Laotian vs Honduran Female Poverty Among 25-34 Year Olds
COMPARE
Laotian
Honduran
Female Poverty Among 25-34 Year Olds
Female Poverty Among 25-34 Year Olds Comparison
Laotians
Hondurans
12.2%
FEMALE POVERTY AMONG 25-34 YEAR OLDS
99.2/ 100
METRIC RATING
67th/ 347
METRIC RANK
16.9%
FEMALE POVERTY AMONG 25-34 YEAR OLDS
0.0/ 100
METRIC RATING
304th/ 347
METRIC RANK
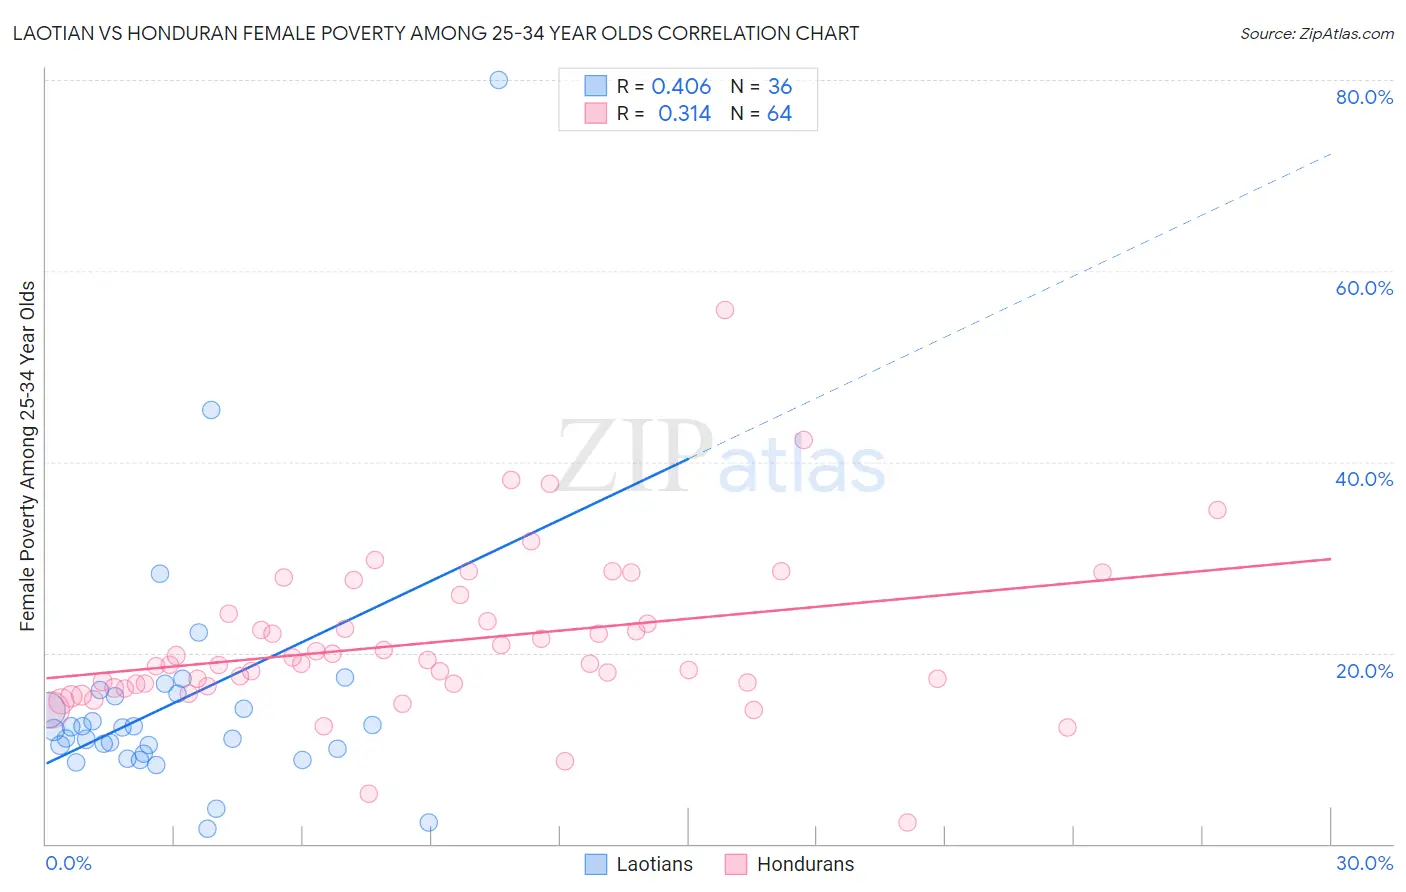
Laotian vs Honduran Female Poverty Among 25-34 Year Olds Correlation Chart
The statistical analysis conducted on geographies consisting of 223,063,253 people shows a moderate positive correlation between the proportion of Laotians and poverty level among females between the ages 25 and 34 in the United States with a correlation coefficient (R) of 0.406 and weighted average of 12.2%. Similarly, the statistical analysis conducted on geographies consisting of 354,770,932 people shows a mild positive correlation between the proportion of Hondurans and poverty level among females between the ages 25 and 34 in the United States with a correlation coefficient (R) of 0.314 and weighted average of 16.9%, a difference of 38.6%.
Female Poverty Among 25-34 Year Olds Correlation Summary
| Measurement | Laotian | Honduran |
| Minimum | 1.6% | 2.2% |
| Maximum | 80.0% | 56.0% |
| Range | 78.4% | 53.7% |
| Mean | 14.8% | 21.1% |
| Median | 12.0% | 18.9% |
| Interquartile 25% (IQ1) | 9.7% | 16.6% |
| Interquartile 75% (IQ3) | 15.5% | 23.7% |
| Interquartile Range (IQR) | 5.8% | 7.1% |
| Standard Deviation (Sample) | 13.4% | 8.5% |
| Standard Deviation (Population) | 13.2% | 8.4% |
Similar Demographics by Female Poverty Among 25-34 Year Olds
Demographics Similar to Laotians by Female Poverty Among 25-34 Year Olds
In terms of female poverty among 25-34 year olds, the demographic groups most similar to Laotians are Immigrants from Europe (12.2%, a difference of 0.12%), Armenian (12.2%, a difference of 0.17%), Immigrants from Russia (12.2%, a difference of 0.19%), Sri Lankan (12.2%, a difference of 0.21%), and Immigrants from Lebanon (12.2%, a difference of 0.23%).
| Demographics | Rating | Rank | Female Poverty Among 25-34 Year Olds |
| Immigrants | Northern Europe | 99.4 /100 | #60 | Exceptional 12.1% |
| Immigrants | Czechoslovakia | 99.4 /100 | #61 | Exceptional 12.1% |
| Immigrants | Moldova | 99.3 /100 | #62 | Exceptional 12.1% |
| Soviet Union | 99.3 /100 | #63 | Exceptional 12.1% |
| Immigrants | Russia | 99.2 /100 | #64 | Exceptional 12.2% |
| Armenians | 99.2 /100 | #65 | Exceptional 12.2% |
| Immigrants | Europe | 99.2 /100 | #66 | Exceptional 12.2% |
| Laotians | 99.2 /100 | #67 | Exceptional 12.2% |
| Sri Lankans | 99.1 /100 | #68 | Exceptional 12.2% |
| Immigrants | Lebanon | 99.1 /100 | #69 | Exceptional 12.2% |
| Immigrants | Belgium | 99.1 /100 | #70 | Exceptional 12.2% |
| Immigrants | Scotland | 99.1 /100 | #71 | Exceptional 12.2% |
| Lithuanians | 99.1 /100 | #72 | Exceptional 12.2% |
| Immigrants | Vietnam | 98.9 /100 | #73 | Exceptional 12.3% |
| Immigrants | Sweden | 98.9 /100 | #74 | Exceptional 12.3% |
Demographics Similar to Hondurans by Female Poverty Among 25-34 Year Olds
In terms of female poverty among 25-34 year olds, the demographic groups most similar to Hondurans are Immigrants from Cabo Verde (16.9%, a difference of 0.17%), Immigrants from Mexico (16.8%, a difference of 0.42%), Alaska Native (16.8%, a difference of 0.73%), Chickasaw (17.0%, a difference of 0.75%), and Yaqui (17.0%, a difference of 0.76%).
| Demographics | Rating | Rank | Female Poverty Among 25-34 Year Olds |
| Immigrants | Guatemala | 0.0 /100 | #297 | Tragic 16.6% |
| Blackfeet | 0.0 /100 | #298 | Tragic 16.7% |
| Spanish Americans | 0.0 /100 | #299 | Tragic 16.7% |
| U.S. Virgin Islanders | 0.0 /100 | #300 | Tragic 16.7% |
| Immigrants | Congo | 0.0 /100 | #301 | Tragic 16.7% |
| Alaska Natives | 0.0 /100 | #302 | Tragic 16.8% |
| Immigrants | Mexico | 0.0 /100 | #303 | Tragic 16.8% |
| Hondurans | 0.0 /100 | #304 | Tragic 16.9% |
| Immigrants | Cabo Verde | 0.0 /100 | #305 | Tragic 16.9% |
| Chickasaw | 0.0 /100 | #306 | Tragic 17.0% |
| Yaqui | 0.0 /100 | #307 | Tragic 17.0% |
| Africans | 0.0 /100 | #308 | Tragic 17.0% |
| Ottawa | 0.0 /100 | #309 | Tragic 17.1% |
| Cherokee | 0.0 /100 | #310 | Tragic 17.2% |
| Immigrants | Honduras | 0.0 /100 | #311 | Tragic 17.3% |