Laotian vs Albanian Receiving Food Stamps
COMPARE
Laotian
Albanian
Receiving Food Stamps
Receiving Food Stamps Comparison
Laotians
Albanians
10.0%
RECEIVING FOOD STAMPS
98.7/ 100
METRIC RATING
79th/ 347
METRIC RANK
12.0%
RECEIVING FOOD STAMPS
35.4/ 100
METRIC RATING
187th/ 347
METRIC RANK
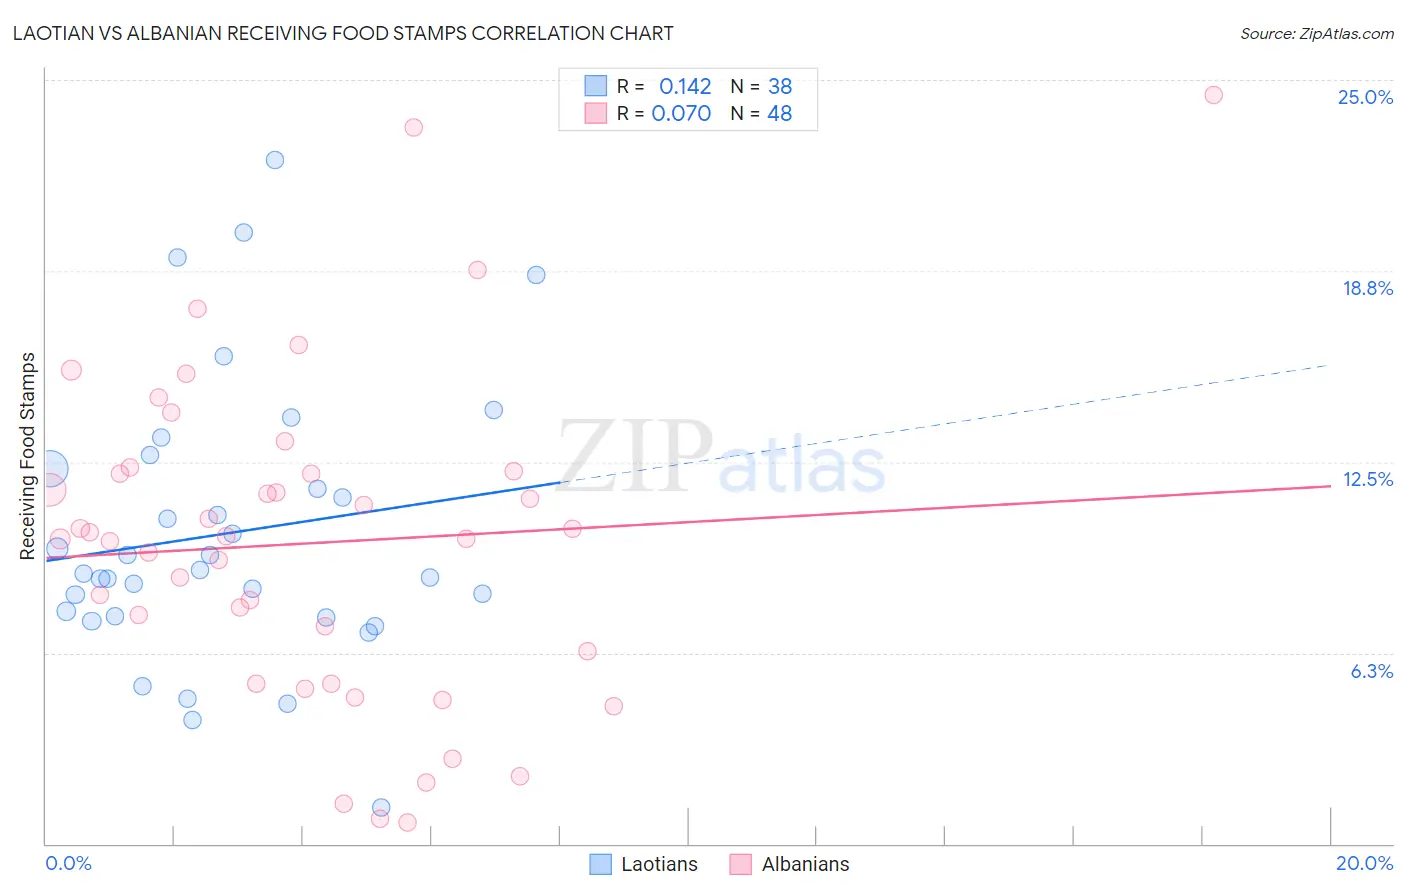
Laotian vs Albanian Receiving Food Stamps Correlation Chart
The statistical analysis conducted on geographies consisting of 224,502,742 people shows a poor positive correlation between the proportion of Laotians and percentage of population receiving government assistance and/or food stamps in the United States with a correlation coefficient (R) of 0.142 and weighted average of 10.0%. Similarly, the statistical analysis conducted on geographies consisting of 192,875,347 people shows a slight positive correlation between the proportion of Albanians and percentage of population receiving government assistance and/or food stamps in the United States with a correlation coefficient (R) of 0.070 and weighted average of 12.0%, a difference of 20.3%.
Receiving Food Stamps Correlation Summary
| Measurement | Laotian | Albanian |
| Minimum | 1.2% | 0.70% |
| Maximum | 22.4% | 24.5% |
| Range | 21.2% | 23.8% |
| Mean | 10.2% | 9.8% |
| Median | 8.9% | 10.0% |
| Interquartile 25% (IQ1) | 7.5% | 5.8% |
| Interquartile 75% (IQ3) | 12.3% | 12.2% |
| Interquartile Range (IQR) | 4.8% | 6.4% |
| Standard Deviation (Sample) | 4.5% | 5.3% |
| Standard Deviation (Population) | 4.5% | 5.2% |
Similar Demographics by Receiving Food Stamps
Demographics Similar to Laotians by Receiving Food Stamps
In terms of receiving food stamps, the demographic groups most similar to Laotians are South African (10.0%, a difference of 0.040%), Immigrants from North Macedonia (10.0%, a difference of 0.080%), Polish (10.0%, a difference of 0.080%), Immigrants from Croatia (10.0%, a difference of 0.17%), and Immigrants from Zimbabwe (9.9%, a difference of 0.18%).
| Demographics | Rating | Rank | Receiving Food Stamps |
| Immigrants | Asia | 98.9 /100 | #72 | Exceptional 9.9% |
| Macedonians | 98.9 /100 | #73 | Exceptional 9.9% |
| New Zealanders | 98.8 /100 | #74 | Exceptional 9.9% |
| Immigrants | Zimbabwe | 98.7 /100 | #75 | Exceptional 9.9% |
| Immigrants | Croatia | 98.7 /100 | #76 | Exceptional 10.0% |
| Immigrants | North Macedonia | 98.7 /100 | #77 | Exceptional 10.0% |
| South Africans | 98.7 /100 | #78 | Exceptional 10.0% |
| Laotians | 98.7 /100 | #79 | Exceptional 10.0% |
| Poles | 98.6 /100 | #80 | Exceptional 10.0% |
| Immigrants | England | 98.6 /100 | #81 | Exceptional 10.0% |
| Austrians | 98.6 /100 | #82 | Exceptional 10.0% |
| Dutch | 98.6 /100 | #83 | Exceptional 10.0% |
| Immigrants | Israel | 98.5 /100 | #84 | Exceptional 10.0% |
| Immigrants | Romania | 98.5 /100 | #85 | Exceptional 10.0% |
| Immigrants | Norway | 98.4 /100 | #86 | Exceptional 10.0% |
Demographics Similar to Albanians by Receiving Food Stamps
In terms of receiving food stamps, the demographic groups most similar to Albanians are Spanish (12.0%, a difference of 0.22%), Immigrants from Iraq (12.0%, a difference of 0.25%), Sudanese (12.0%, a difference of 0.31%), Immigrants from Cameroon (12.0%, a difference of 0.44%), and Immigrants from Peru (12.0%, a difference of 0.50%).
| Demographics | Rating | Rank | Receiving Food Stamps |
| Uruguayans | 44.8 /100 | #180 | Average 11.8% |
| South American Indians | 41.7 /100 | #181 | Average 11.9% |
| Immigrants | Morocco | 40.7 /100 | #182 | Average 11.9% |
| Immigrants | Uganda | 40.3 /100 | #183 | Average 11.9% |
| Spaniards | 39.8 /100 | #184 | Fair 11.9% |
| Immigrants | Iraq | 37.1 /100 | #185 | Fair 12.0% |
| Spanish | 36.9 /100 | #186 | Fair 12.0% |
| Albanians | 35.4 /100 | #187 | Fair 12.0% |
| Sudanese | 33.4 /100 | #188 | Fair 12.0% |
| Immigrants | Cameroon | 32.5 /100 | #189 | Fair 12.0% |
| Immigrants | Peru | 32.2 /100 | #190 | Fair 12.0% |
| Venezuelans | 32.1 /100 | #191 | Fair 12.0% |
| Samoans | 31.0 /100 | #192 | Fair 12.1% |
| Immigrants | Fiji | 27.8 /100 | #193 | Fair 12.1% |
| Immigrants | Sudan | 27.1 /100 | #194 | Fair 12.1% |