Kiowa vs Immigrants from Honduras Child Poverty Among Boys Under 16
COMPARE
Kiowa
Immigrants from Honduras
Child Poverty Among Boys Under 16
Child Poverty Among Boys Under 16 Comparison
Kiowa
Immigrants from Honduras
21.3%
CHILD POVERTY AMONG BOYS UNDER 16
0.0/ 100
METRIC RATING
305th/ 347
METRIC RANK
22.8%
CHILD POVERTY AMONG BOYS UNDER 16
0.0/ 100
METRIC RATING
327th/ 347
METRIC RANK
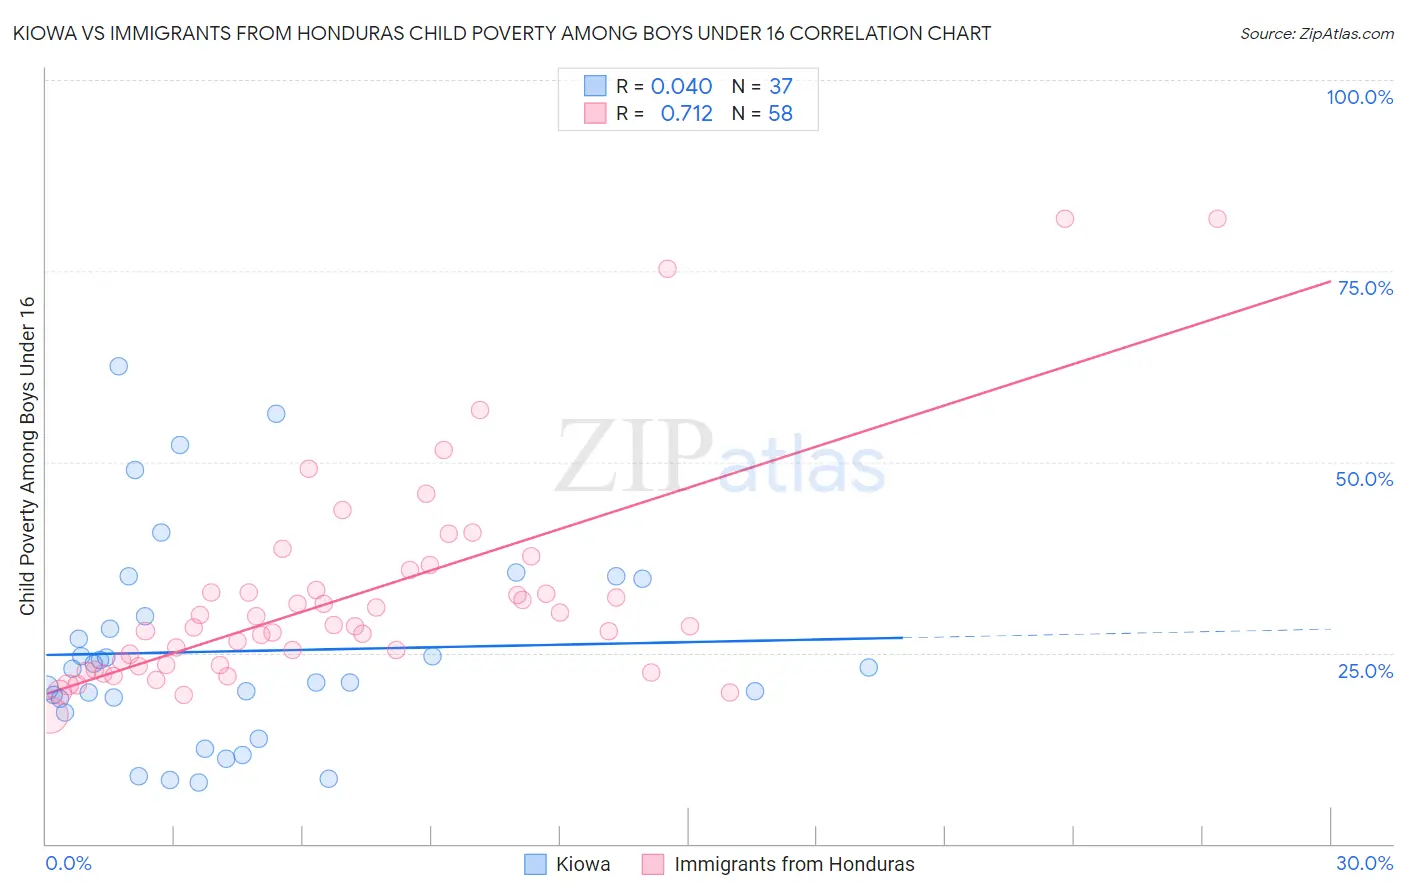
Kiowa vs Immigrants from Honduras Child Poverty Among Boys Under 16 Correlation Chart
The statistical analysis conducted on geographies consisting of 55,969,727 people shows no correlation between the proportion of Kiowa and poverty level among boys under the age of 16 in the United States with a correlation coefficient (R) of 0.040 and weighted average of 21.3%. Similarly, the statistical analysis conducted on geographies consisting of 320,355,398 people shows a strong positive correlation between the proportion of Immigrants from Honduras and poverty level among boys under the age of 16 in the United States with a correlation coefficient (R) of 0.712 and weighted average of 22.8%, a difference of 7.0%.
Child Poverty Among Boys Under 16 Correlation Summary
| Measurement | Kiowa | Immigrants from Honduras |
| Minimum | 8.0% | 16.9% |
| Maximum | 62.5% | 81.8% |
| Range | 54.5% | 65.0% |
| Mean | 25.2% | 32.3% |
| Median | 22.9% | 28.4% |
| Interquartile 25% (IQ1) | 18.1% | 23.3% |
| Interquartile 75% (IQ3) | 32.3% | 33.2% |
| Interquartile Range (IQR) | 14.2% | 9.9% |
| Standard Deviation (Sample) | 13.4% | 13.9% |
| Standard Deviation (Population) | 13.2% | 13.8% |
Similar Demographics by Child Poverty Among Boys Under 16
Demographics Similar to Kiowa by Child Poverty Among Boys Under 16
In terms of child poverty among boys under 16, the demographic groups most similar to Kiowa are Immigrants from Grenada (21.3%, a difference of 0.010%), Choctaw (21.3%, a difference of 0.10%), Immigrants from Central America (21.3%, a difference of 0.17%), Immigrants from Haiti (21.3%, a difference of 0.23%), and Somali (21.1%, a difference of 0.76%).
| Demographics | Rating | Rank | Child Poverty Among Boys Under 16 |
| Chippewa | 0.0 /100 | #298 | Tragic 21.0% |
| Immigrants | Caribbean | 0.0 /100 | #299 | Tragic 21.0% |
| Haitians | 0.0 /100 | #300 | Tragic 21.0% |
| Guatemalans | 0.0 /100 | #301 | Tragic 21.1% |
| Somalis | 0.0 /100 | #302 | Tragic 21.1% |
| Immigrants | Haiti | 0.0 /100 | #303 | Tragic 21.3% |
| Immigrants | Central America | 0.0 /100 | #304 | Tragic 21.3% |
| Kiowa | 0.0 /100 | #305 | Tragic 21.3% |
| Immigrants | Grenada | 0.0 /100 | #306 | Tragic 21.3% |
| Choctaw | 0.0 /100 | #307 | Tragic 21.3% |
| Immigrants | Mexico | 0.0 /100 | #308 | Tragic 21.5% |
| Seminole | 0.0 /100 | #309 | Tragic 21.5% |
| Creek | 0.0 /100 | #310 | Tragic 21.5% |
| Bahamians | 0.0 /100 | #311 | Tragic 21.6% |
| Immigrants | Guatemala | 0.0 /100 | #312 | Tragic 21.6% |
Demographics Similar to Immigrants from Honduras by Child Poverty Among Boys Under 16
In terms of child poverty among boys under 16, the demographic groups most similar to Immigrants from Honduras are Paiute (22.8%, a difference of 0.12%), Central American Indian (22.5%, a difference of 1.3%), Immigrants from Congo (22.4%, a difference of 1.8%), Honduran (22.3%, a difference of 2.1%), and Immigrants from Dominica (22.2%, a difference of 2.7%).
| Demographics | Rating | Rank | Child Poverty Among Boys Under 16 |
| U.S. Virgin Islanders | 0.0 /100 | #320 | Tragic 22.0% |
| Cajuns | 0.0 /100 | #321 | Tragic 22.2% |
| Immigrants | Dominica | 0.0 /100 | #322 | Tragic 22.2% |
| Hondurans | 0.0 /100 | #323 | Tragic 22.3% |
| Immigrants | Congo | 0.0 /100 | #324 | Tragic 22.4% |
| Central American Indians | 0.0 /100 | #325 | Tragic 22.5% |
| Paiute | 0.0 /100 | #326 | Tragic 22.8% |
| Immigrants | Honduras | 0.0 /100 | #327 | Tragic 22.8% |
| Pueblo | 0.0 /100 | #328 | Tragic 23.5% |
| Natives/Alaskans | 0.0 /100 | #329 | Tragic 24.0% |
| Colville | 0.0 /100 | #330 | Tragic 24.1% |
| Dominicans | 0.0 /100 | #331 | Tragic 24.2% |
| Immigrants | Dominican Republic | 0.0 /100 | #332 | Tragic 24.3% |
| Apache | 0.0 /100 | #333 | Tragic 24.5% |
| Blacks/African Americans | 0.0 /100 | #334 | Tragic 24.5% |