Jordanian vs Yup'ik Seniors Poverty Over the Age of 75
COMPARE
Jordanian
Yup'ik
Seniors Poverty Over the Age of 75
Seniors Poverty Over the Age of 75 Comparison
Jordanians
Yup'ik
11.6%
SENIORS POVERTY OVER THE AGE OF 75
90.8/ 100
METRIC RATING
101st/ 347
METRIC RANK
15.8%
SENIORS POVERTY OVER THE AGE OF 75
0.0/ 100
METRIC RATING
309th/ 347
METRIC RANK
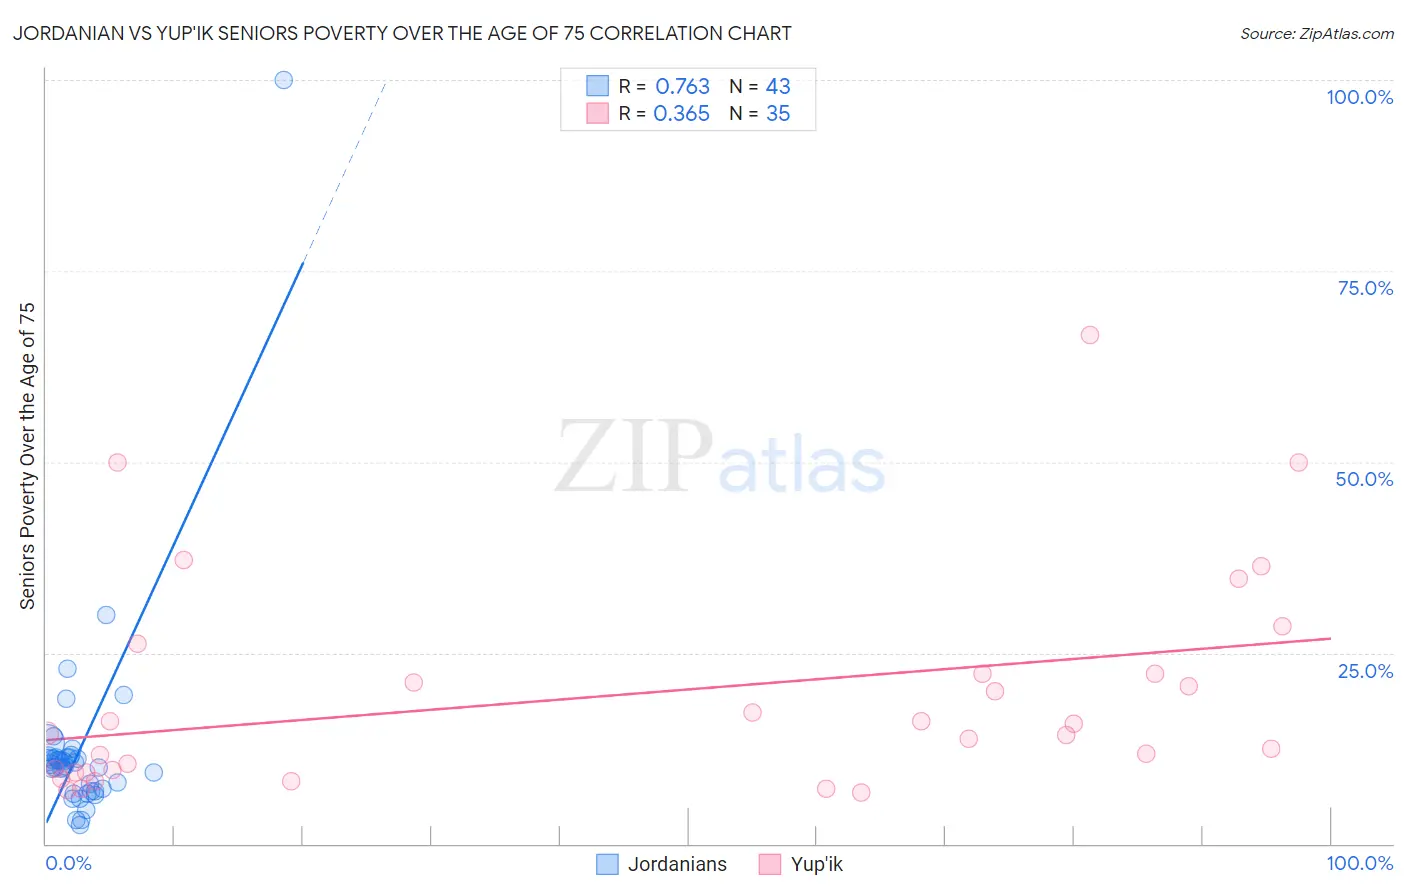
Jordanian vs Yup'ik Seniors Poverty Over the Age of 75 Correlation Chart
The statistical analysis conducted on geographies consisting of 165,896,130 people shows a strong positive correlation between the proportion of Jordanians and poverty level among seniors over the age of 75 in the United States with a correlation coefficient (R) of 0.763 and weighted average of 11.6%. Similarly, the statistical analysis conducted on geographies consisting of 39,739,861 people shows a mild positive correlation between the proportion of Yup'ik and poverty level among seniors over the age of 75 in the United States with a correlation coefficient (R) of 0.365 and weighted average of 15.8%, a difference of 36.3%.
Seniors Poverty Over the Age of 75 Correlation Summary
| Measurement | Jordanian | Yup'ik |
| Minimum | 2.4% | 6.8% |
| Maximum | 100.0% | 66.7% |
| Range | 97.6% | 59.9% |
| Mean | 12.5% | 19.5% |
| Median | 10.4% | 14.4% |
| Interquartile 25% (IQ1) | 6.9% | 9.4% |
| Interquartile 75% (IQ3) | 11.3% | 22.2% |
| Interquartile Range (IQR) | 4.4% | 12.8% |
| Standard Deviation (Sample) | 14.6% | 14.2% |
| Standard Deviation (Population) | 14.4% | 14.0% |
Similar Demographics by Seniors Poverty Over the Age of 75
Demographics Similar to Jordanians by Seniors Poverty Over the Age of 75
In terms of seniors poverty over the age of 75, the demographic groups most similar to Jordanians are Guamanian/Chamorro (11.6%, a difference of 0.040%), Syrian (11.6%, a difference of 0.080%), Immigrants from Kuwait (11.6%, a difference of 0.080%), Immigrants from Singapore (11.6%, a difference of 0.13%), and Chickasaw (11.6%, a difference of 0.14%).
| Demographics | Rating | Rank | Seniors Poverty Over the Age of 75 |
| Creek | 92.7 /100 | #94 | Exceptional 11.6% |
| Immigrants | Bosnia and Herzegovina | 92.6 /100 | #95 | Exceptional 11.6% |
| Immigrants | Sweden | 92.6 /100 | #96 | Exceptional 11.6% |
| Romanians | 92.3 /100 | #97 | Exceptional 11.6% |
| Immigrants | Japan | 91.9 /100 | #98 | Exceptional 11.6% |
| Immigrants | Ethiopia | 91.7 /100 | #99 | Exceptional 11.6% |
| Syrians | 91.1 /100 | #100 | Exceptional 11.6% |
| Jordanians | 90.8 /100 | #101 | Exceptional 11.6% |
| Guamanians/Chamorros | 90.6 /100 | #102 | Exceptional 11.6% |
| Immigrants | Kuwait | 90.5 /100 | #103 | Exceptional 11.6% |
| Immigrants | Singapore | 90.3 /100 | #104 | Exceptional 11.6% |
| Chickasaw | 90.2 /100 | #105 | Exceptional 11.6% |
| Russians | 89.9 /100 | #106 | Excellent 11.6% |
| Immigrants | Oceania | 89.4 /100 | #107 | Excellent 11.7% |
| Turks | 89.4 /100 | #108 | Excellent 11.7% |
Demographics Similar to Yup'ik by Seniors Poverty Over the Age of 75
In terms of seniors poverty over the age of 75, the demographic groups most similar to Yup'ik are Vietnamese (15.9%, a difference of 0.10%), Trinidadian and Tobagonian (15.9%, a difference of 0.20%), Immigrants from Bangladesh (15.8%, a difference of 0.30%), Immigrants from West Indies (15.8%, a difference of 0.34%), and Hispanic or Latino (15.8%, a difference of 0.48%).
| Demographics | Rating | Rank | Seniors Poverty Over the Age of 75 |
| West Indians | 0.0 /100 | #302 | Tragic 15.7% |
| Immigrants | Honduras | 0.0 /100 | #303 | Tragic 15.7% |
| Immigrants | Trinidad and Tobago | 0.0 /100 | #304 | Tragic 15.7% |
| Ecuadorians | 0.0 /100 | #305 | Tragic 15.7% |
| Hispanics or Latinos | 0.0 /100 | #306 | Tragic 15.8% |
| Immigrants | West Indies | 0.0 /100 | #307 | Tragic 15.8% |
| Immigrants | Bangladesh | 0.0 /100 | #308 | Tragic 15.8% |
| Yup'ik | 0.0 /100 | #309 | Tragic 15.8% |
| Vietnamese | 0.0 /100 | #310 | Tragic 15.9% |
| Trinidadians and Tobagonians | 0.0 /100 | #311 | Tragic 15.9% |
| Crow | 0.0 /100 | #312 | Tragic 15.9% |
| Barbadians | 0.0 /100 | #313 | Tragic 16.0% |
| Tsimshian | 0.0 /100 | #314 | Tragic 16.1% |
| Guyanese | 0.0 /100 | #315 | Tragic 16.1% |
| Immigrants | Ecuador | 0.0 /100 | #316 | Tragic 16.1% |