Japanese vs Yuman Child Poverty Among Girls Under 16
COMPARE
Japanese
Yuman
Child Poverty Among Girls Under 16
Child Poverty Among Girls Under 16 Comparison
Japanese
Yuman
17.8%
CHILD POVERTY AMONG GIRLS UNDER 16
5.3/ 100
METRIC RATING
217th/ 347
METRIC RANK
27.1%
CHILD POVERTY AMONG GIRLS UNDER 16
0.0/ 100
METRIC RATING
340th/ 347
METRIC RANK
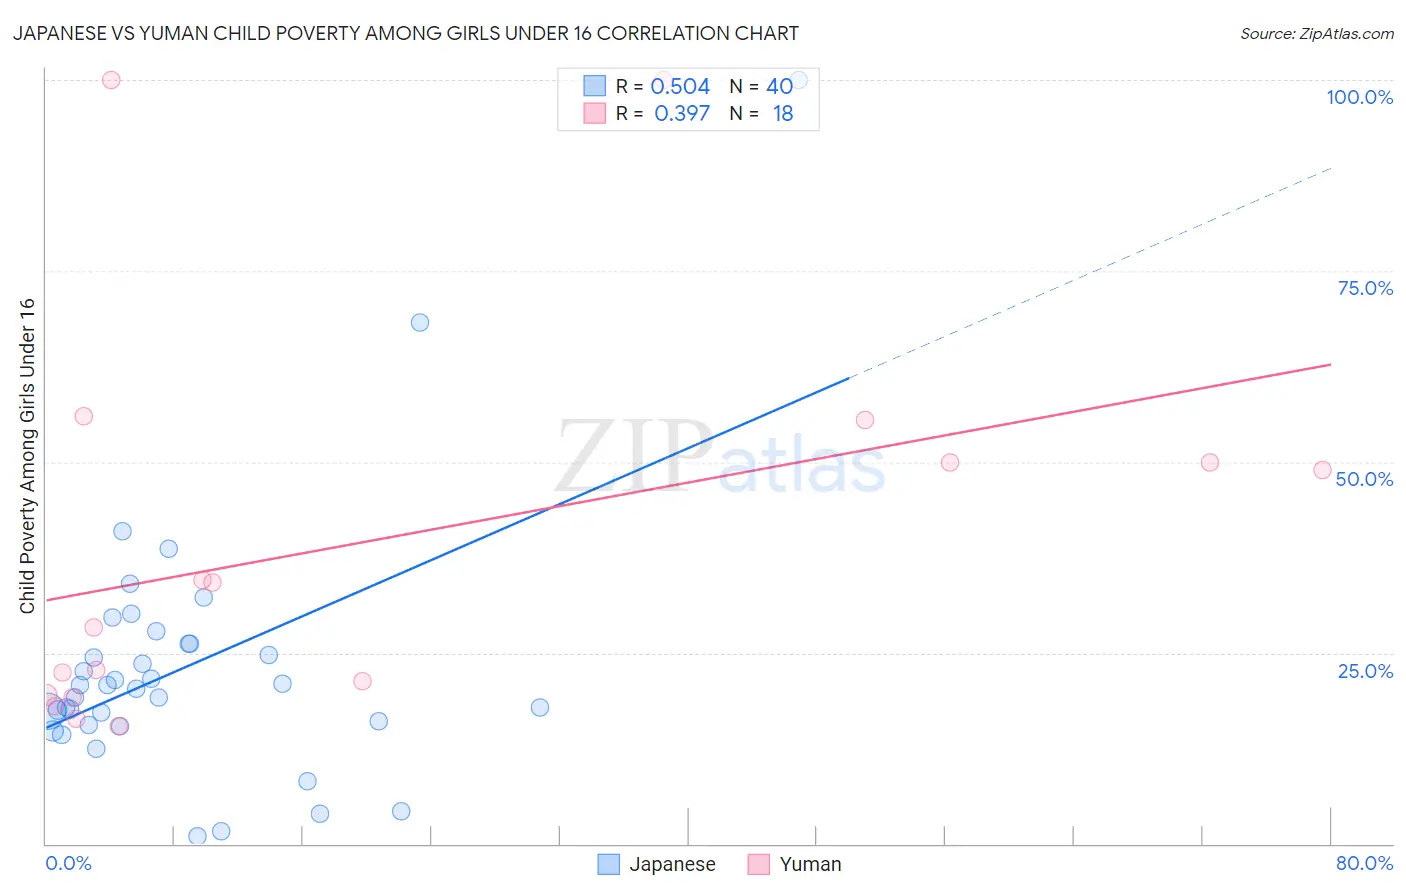
Japanese vs Yuman Child Poverty Among Girls Under 16 Correlation Chart
The statistical analysis conducted on geographies consisting of 247,332,708 people shows a substantial positive correlation between the proportion of Japanese and poverty level among girls under the age of 16 in the United States with a correlation coefficient (R) of 0.504 and weighted average of 17.8%. Similarly, the statistical analysis conducted on geographies consisting of 40,600,954 people shows a mild positive correlation between the proportion of Yuman and poverty level among girls under the age of 16 in the United States with a correlation coefficient (R) of 0.397 and weighted average of 27.1%, a difference of 51.9%.
Child Poverty Among Girls Under 16 Correlation Summary
| Measurement | Japanese | Yuman |
| Minimum | 1.0% | 15.3% |
| Maximum | 100.0% | 100.0% |
| Range | 99.0% | 84.7% |
| Mean | 23.2% | 39.6% |
| Median | 20.5% | 31.3% |
| Interquartile 25% (IQ1) | 15.8% | 19.5% |
| Interquartile 75% (IQ3) | 26.2% | 50.0% |
| Interquartile Range (IQR) | 10.4% | 30.5% |
| Standard Deviation (Sample) | 17.1% | 26.2% |
| Standard Deviation (Population) | 16.9% | 25.4% |
Similar Demographics by Child Poverty Among Girls Under 16
Demographics Similar to Japanese by Child Poverty Among Girls Under 16
In terms of child poverty among girls under 16, the demographic groups most similar to Japanese are Moroccan (17.8%, a difference of 0.090%), Alaska Native (17.8%, a difference of 0.10%), Malaysian (17.8%, a difference of 0.19%), German Russian (17.8%, a difference of 0.19%), and Pennsylvania German (17.8%, a difference of 0.21%).
| Demographics | Rating | Rank | Child Poverty Among Girls Under 16 |
| Immigrants | Immigrants | 7.3 /100 | #210 | Tragic 17.7% |
| Immigrants | Eastern Africa | 6.4 /100 | #211 | Tragic 17.7% |
| Immigrants | Thailand | 6.3 /100 | #212 | Tragic 17.7% |
| Pennsylvania Germans | 5.7 /100 | #213 | Tragic 17.8% |
| Malaysians | 5.7 /100 | #214 | Tragic 17.8% |
| German Russians | 5.7 /100 | #215 | Tragic 17.8% |
| Moroccans | 5.5 /100 | #216 | Tragic 17.8% |
| Japanese | 5.3 /100 | #217 | Tragic 17.8% |
| Alaska Natives | 5.2 /100 | #218 | Tragic 17.8% |
| Immigrants | Panama | 4.7 /100 | #219 | Tragic 17.9% |
| Cubans | 4.1 /100 | #220 | Tragic 18.0% |
| Immigrants | Micronesia | 3.5 /100 | #221 | Tragic 18.0% |
| Immigrants | Cambodia | 2.9 /100 | #222 | Tragic 18.1% |
| Immigrants | Armenia | 2.9 /100 | #223 | Tragic 18.1% |
| Bermudans | 2.8 /100 | #224 | Tragic 18.1% |
Demographics Similar to Yuman by Child Poverty Among Girls Under 16
In terms of child poverty among girls under 16, the demographic groups most similar to Yuman are Crow (26.4%, a difference of 2.7%), Hopi (27.9%, a difference of 2.9%), Cheyenne (26.3%, a difference of 3.1%), Pima (28.2%, a difference of 4.2%), and Yup'ik (25.8%, a difference of 4.9%).
| Demographics | Rating | Rank | Child Poverty Among Girls Under 16 |
| Blacks/African Americans | 0.0 /100 | #333 | Tragic 24.7% |
| Menominee | 0.0 /100 | #334 | Tragic 25.0% |
| Pueblo | 0.0 /100 | #335 | Tragic 25.2% |
| Sioux | 0.0 /100 | #336 | Tragic 25.6% |
| Yup'ik | 0.0 /100 | #337 | Tragic 25.8% |
| Cheyenne | 0.0 /100 | #338 | Tragic 26.3% |
| Crow | 0.0 /100 | #339 | Tragic 26.4% |
| Yuman | 0.0 /100 | #340 | Tragic 27.1% |
| Hopi | 0.0 /100 | #341 | Tragic 27.9% |
| Pima | 0.0 /100 | #342 | Tragic 28.2% |
| Immigrants | Yemen | 0.0 /100 | #343 | Tragic 29.5% |
| Navajo | 0.0 /100 | #344 | Tragic 30.5% |
| Lumbee | 0.0 /100 | #345 | Tragic 30.7% |
| Tohono O'odham | 0.0 /100 | #346 | Tragic 31.6% |
| Puerto Ricans | 0.0 /100 | #347 | Tragic 32.7% |