Jamaican vs Immigrants from Guatemala Male Poverty
COMPARE
Jamaican
Immigrants from Guatemala
Male Poverty
Male Poverty Comparison
Jamaicans
Immigrants from Guatemala
13.2%
MALE POVERTY
0.1/ 100
METRIC RATING
265th/ 347
METRIC RANK
14.0%
MALE POVERTY
0.0/ 100
METRIC RATING
299th/ 347
METRIC RANK
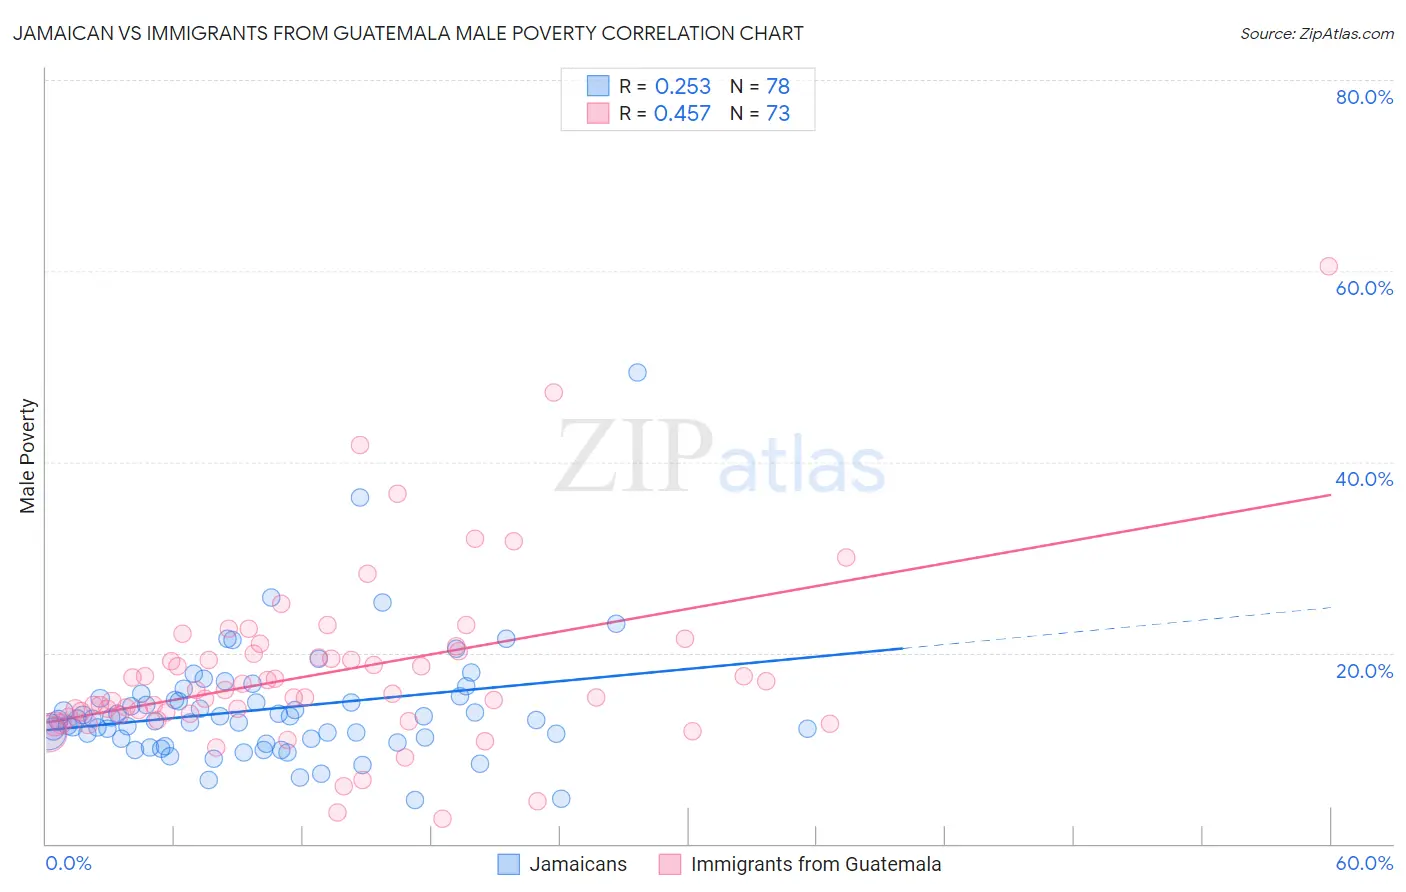
Jamaican vs Immigrants from Guatemala Male Poverty Correlation Chart
The statistical analysis conducted on geographies consisting of 367,625,725 people shows a weak positive correlation between the proportion of Jamaicans and poverty level among males in the United States with a correlation coefficient (R) of 0.253 and weighted average of 13.2%. Similarly, the statistical analysis conducted on geographies consisting of 377,090,966 people shows a moderate positive correlation between the proportion of Immigrants from Guatemala and poverty level among males in the United States with a correlation coefficient (R) of 0.457 and weighted average of 14.0%, a difference of 6.0%.
Male Poverty Correlation Summary
| Measurement | Jamaican | Immigrants from Guatemala |
| Minimum | 4.6% | 2.7% |
| Maximum | 49.4% | 60.5% |
| Range | 44.8% | 57.9% |
| Mean | 14.1% | 17.9% |
| Median | 13.0% | 15.7% |
| Interquartile 25% (IQ1) | 11.0% | 13.4% |
| Interquartile 75% (IQ3) | 15.2% | 20.1% |
| Interquartile Range (IQR) | 4.2% | 6.7% |
| Standard Deviation (Sample) | 6.3% | 9.2% |
| Standard Deviation (Population) | 6.3% | 9.1% |
Similar Demographics by Male Poverty
Demographics Similar to Jamaicans by Male Poverty
In terms of male poverty, the demographic groups most similar to Jamaicans are Iroquois (13.2%, a difference of 0.020%), Immigrants from Guyana (13.2%, a difference of 0.14%), Immigrants from Jamaica (13.3%, a difference of 0.26%), Subsaharan African (13.3%, a difference of 0.28%), and Central American (13.2%, a difference of 0.38%).
| Demographics | Rating | Rank | Male Poverty |
| Cape Verdeans | 0.1 /100 | #258 | Tragic 13.1% |
| Cherokee | 0.1 /100 | #259 | Tragic 13.1% |
| Ottawa | 0.1 /100 | #260 | Tragic 13.1% |
| Trinidadians and Tobagonians | 0.1 /100 | #261 | Tragic 13.1% |
| Spanish American Indians | 0.1 /100 | #262 | Tragic 13.1% |
| Central Americans | 0.1 /100 | #263 | Tragic 13.2% |
| Iroquois | 0.1 /100 | #264 | Tragic 13.2% |
| Jamaicans | 0.1 /100 | #265 | Tragic 13.2% |
| Immigrants | Guyana | 0.1 /100 | #266 | Tragic 13.2% |
| Immigrants | Jamaica | 0.1 /100 | #267 | Tragic 13.3% |
| Sub-Saharan Africans | 0.1 /100 | #268 | Tragic 13.3% |
| Guyanese | 0.0 /100 | #269 | Tragic 13.3% |
| Cree | 0.0 /100 | #270 | Tragic 13.3% |
| Spanish Americans | 0.0 /100 | #271 | Tragic 13.4% |
| Immigrants | Bahamas | 0.0 /100 | #272 | Tragic 13.5% |
Demographics Similar to Immigrants from Guatemala by Male Poverty
In terms of male poverty, the demographic groups most similar to Immigrants from Guatemala are Blackfeet (14.0%, a difference of 0.10%), Immigrants from Mexico (14.0%, a difference of 0.12%), Inupiat (14.0%, a difference of 0.13%), Immigrants from Senegal (14.0%, a difference of 0.18%), and Immigrants from Caribbean (14.0%, a difference of 0.24%).
| Demographics | Rating | Rank | Male Poverty |
| Indonesians | 0.0 /100 | #292 | Tragic 13.8% |
| Immigrants | Belize | 0.0 /100 | #293 | Tragic 13.8% |
| Hispanics or Latinos | 0.0 /100 | #294 | Tragic 13.9% |
| Immigrants | Central America | 0.0 /100 | #295 | Tragic 13.9% |
| Cajuns | 0.0 /100 | #296 | Tragic 13.9% |
| Inupiat | 0.0 /100 | #297 | Tragic 14.0% |
| Blackfeet | 0.0 /100 | #298 | Tragic 14.0% |
| Immigrants | Guatemala | 0.0 /100 | #299 | Tragic 14.0% |
| Immigrants | Mexico | 0.0 /100 | #300 | Tragic 14.0% |
| Immigrants | Senegal | 0.0 /100 | #301 | Tragic 14.0% |
| Immigrants | Caribbean | 0.0 /100 | #302 | Tragic 14.0% |
| Bahamians | 0.0 /100 | #303 | Tragic 14.1% |
| Senegalese | 0.0 /100 | #304 | Tragic 14.1% |
| Immigrants | Bangladesh | 0.0 /100 | #305 | Tragic 14.1% |
| Creek | 0.0 /100 | #306 | Tragic 14.1% |