Italian vs Belizean Female Poverty Among 25-34 Year Olds
COMPARE
Italian
Belizean
Female Poverty Among 25-34 Year Olds
Female Poverty Among 25-34 Year Olds Comparison
Italians
Belizeans
12.5%
FEMALE POVERTY AMONG 25-34 YEAR OLDS
97.2/ 100
METRIC RATING
89th/ 347
METRIC RANK
15.1%
FEMALE POVERTY AMONG 25-34 YEAR OLDS
0.4/ 100
METRIC RATING
252nd/ 347
METRIC RANK
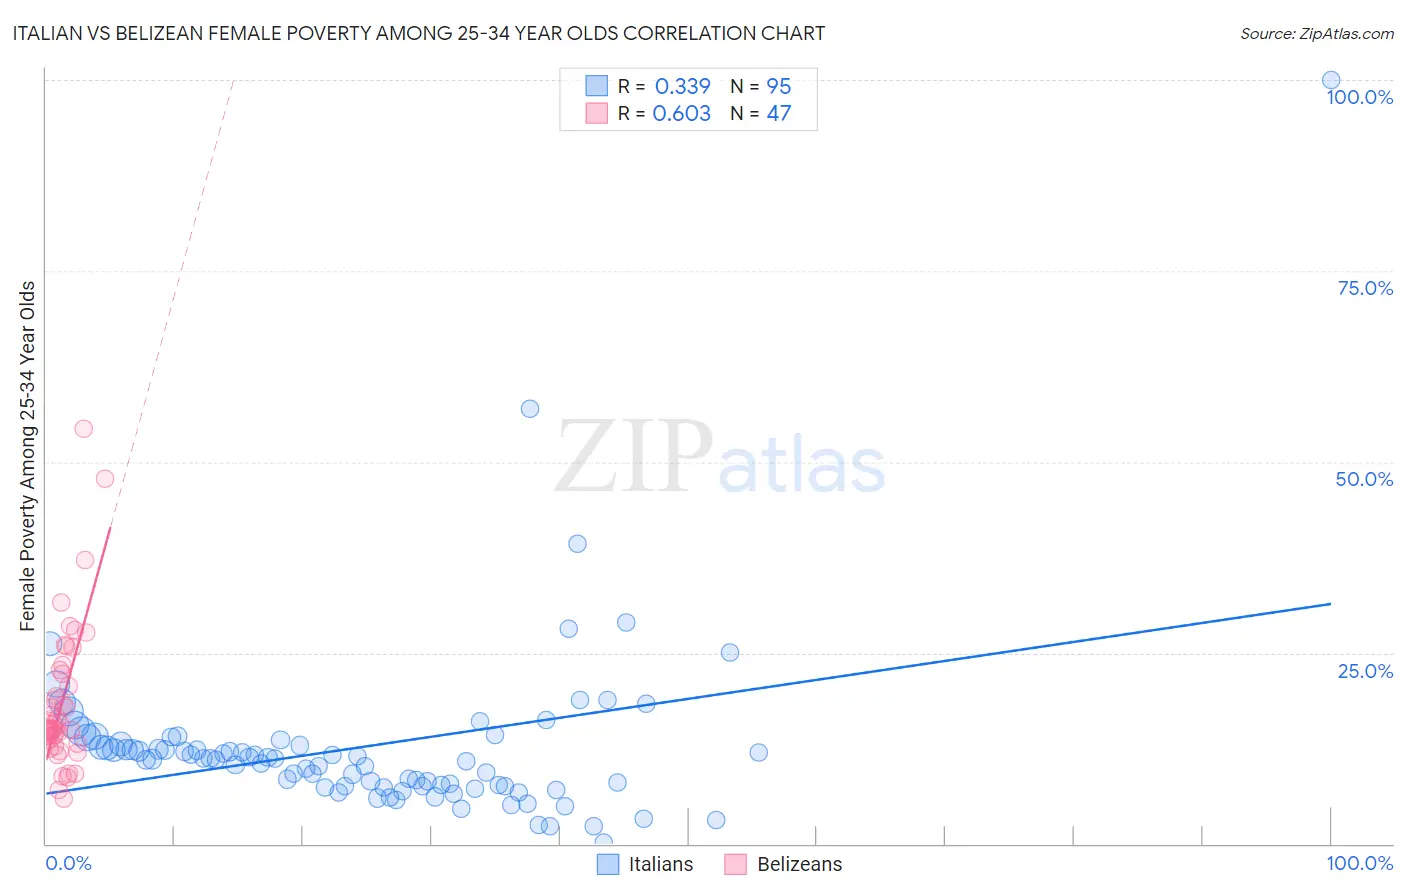
Italian vs Belizean Female Poverty Among 25-34 Year Olds Correlation Chart
The statistical analysis conducted on geographies consisting of 551,961,209 people shows a mild positive correlation between the proportion of Italians and poverty level among females between the ages 25 and 34 in the United States with a correlation coefficient (R) of 0.339 and weighted average of 12.5%. Similarly, the statistical analysis conducted on geographies consisting of 143,799,861 people shows a significant positive correlation between the proportion of Belizeans and poverty level among females between the ages 25 and 34 in the United States with a correlation coefficient (R) of 0.603 and weighted average of 15.1%, a difference of 20.2%.
Female Poverty Among 25-34 Year Olds Correlation Summary
| Measurement | Italian | Belizean |
| Minimum | 0.18% | 6.0% |
| Maximum | 100.0% | 54.4% |
| Range | 99.8% | 48.4% |
| Mean | 12.7% | 18.7% |
| Median | 11.1% | 15.1% |
| Interquartile 25% (IQ1) | 7.5% | 13.0% |
| Interquartile 75% (IQ3) | 13.1% | 22.8% |
| Interquartile Range (IQR) | 5.5% | 9.8% |
| Standard Deviation (Sample) | 11.8% | 9.6% |
| Standard Deviation (Population) | 11.8% | 9.5% |
Similar Demographics by Female Poverty Among 25-34 Year Olds
Demographics Similar to Italians by Female Poverty Among 25-34 Year Olds
In terms of female poverty among 25-34 year olds, the demographic groups most similar to Italians are Immigrants from Albania (12.5%, a difference of 0.15%), Immigrants from Austria (12.5%, a difference of 0.17%), Argentinean (12.5%, a difference of 0.24%), Norwegian (12.6%, a difference of 0.25%), and Croatian (12.5%, a difference of 0.27%).
| Demographics | Rating | Rank | Female Poverty Among 25-34 Year Olds |
| Ethiopians | 98.0 /100 | #82 | Exceptional 12.4% |
| Albanians | 97.7 /100 | #83 | Exceptional 12.5% |
| Immigrants | Latvia | 97.7 /100 | #84 | Exceptional 12.5% |
| Immigrants | South Eastern Asia | 97.6 /100 | #85 | Exceptional 12.5% |
| Croatians | 97.5 /100 | #86 | Exceptional 12.5% |
| Argentineans | 97.5 /100 | #87 | Exceptional 12.5% |
| Immigrants | Austria | 97.4 /100 | #88 | Exceptional 12.5% |
| Italians | 97.2 /100 | #89 | Exceptional 12.5% |
| Immigrants | Albania | 97.1 /100 | #90 | Exceptional 12.5% |
| Norwegians | 96.9 /100 | #91 | Exceptional 12.6% |
| Immigrants | Armenia | 96.9 /100 | #92 | Exceptional 12.6% |
| Palestinians | 96.9 /100 | #93 | Exceptional 12.6% |
| Immigrants | France | 96.8 /100 | #94 | Exceptional 12.6% |
| Ukrainians | 96.7 /100 | #95 | Exceptional 12.6% |
| Immigrants | Zimbabwe | 96.7 /100 | #96 | Exceptional 12.6% |
Demographics Similar to Belizeans by Female Poverty Among 25-34 Year Olds
In terms of female poverty among 25-34 year olds, the demographic groups most similar to Belizeans are Immigrants from West Indies (15.1%, a difference of 0.14%), Haitian (15.0%, a difference of 0.17%), Somali (15.1%, a difference of 0.22%), Immigrants from El Salvador (15.0%, a difference of 0.36%), and Immigrants from Haiti (15.0%, a difference of 0.39%).
| Demographics | Rating | Rank | Female Poverty Among 25-34 Year Olds |
| Immigrants | Middle Africa | 1.0 /100 | #245 | Tragic 14.8% |
| Jamaicans | 1.0 /100 | #246 | Tragic 14.8% |
| German Russians | 0.8 /100 | #247 | Tragic 14.9% |
| Immigrants | Western Africa | 0.8 /100 | #248 | Tragic 14.9% |
| Immigrants | Haiti | 0.5 /100 | #249 | Tragic 15.0% |
| Immigrants | El Salvador | 0.5 /100 | #250 | Tragic 15.0% |
| Haitians | 0.5 /100 | #251 | Tragic 15.0% |
| Belizeans | 0.4 /100 | #252 | Tragic 15.1% |
| Immigrants | West Indies | 0.4 /100 | #253 | Tragic 15.1% |
| Somalis | 0.4 /100 | #254 | Tragic 15.1% |
| Immigrants | Laos | 0.3 /100 | #255 | Tragic 15.2% |
| West Indians | 0.3 /100 | #256 | Tragic 15.2% |
| Immigrants | Burma/Myanmar | 0.3 /100 | #257 | Tragic 15.2% |
| Nepalese | 0.2 /100 | #258 | Tragic 15.2% |
| Immigrants | Cuba | 0.2 /100 | #259 | Tragic 15.2% |