Israeli vs Sri Lankan Female Poverty
COMPARE
Israeli
Sri Lankan
Female Poverty
Female Poverty Comparison
Israelis
Sri Lankans
13.5%
FEMALE POVERTY
49.1/ 100
METRIC RATING
178th/ 347
METRIC RANK
12.7%
FEMALE POVERTY
90.9/ 100
METRIC RATING
118th/ 347
METRIC RANK
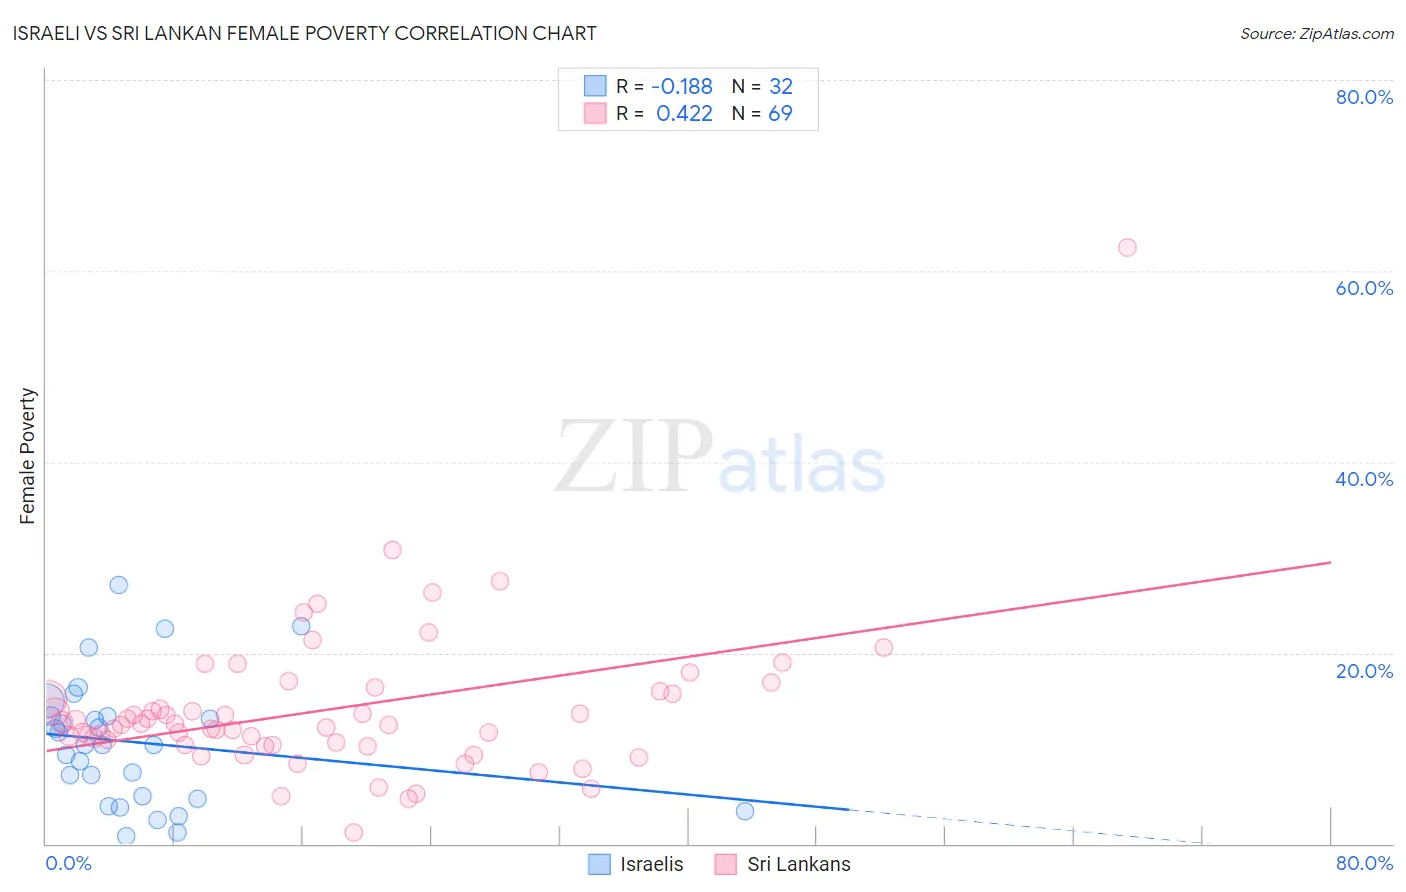
Israeli vs Sri Lankan Female Poverty Correlation Chart
The statistical analysis conducted on geographies consisting of 211,005,124 people shows a poor negative correlation between the proportion of Israelis and poverty level among females in the United States with a correlation coefficient (R) of -0.188 and weighted average of 13.5%. Similarly, the statistical analysis conducted on geographies consisting of 440,042,655 people shows a moderate positive correlation between the proportion of Sri Lankans and poverty level among females in the United States with a correlation coefficient (R) of 0.422 and weighted average of 12.7%, a difference of 5.9%.
Female Poverty Correlation Summary
| Measurement | Israeli | Sri Lankan |
| Minimum | 0.76% | 1.2% |
| Maximum | 27.1% | 62.5% |
| Range | 26.4% | 61.3% |
| Mean | 10.6% | 14.0% |
| Median | 10.3% | 12.5% |
| Interquartile 25% (IQ1) | 4.9% | 10.3% |
| Interquartile 75% (IQ3) | 13.4% | 15.8% |
| Interquartile Range (IQR) | 8.5% | 5.5% |
| Standard Deviation (Sample) | 6.6% | 8.1% |
| Standard Deviation (Population) | 6.5% | 8.0% |
Similar Demographics by Female Poverty
Demographics Similar to Israelis by Female Poverty
In terms of female poverty, the demographic groups most similar to Israelis are Immigrants from Morocco (13.4%, a difference of 0.030%), Immigrants from Syria (13.5%, a difference of 0.030%), Celtic (13.4%, a difference of 0.080%), Immigrants from Spain (13.4%, a difference of 0.080%), and Immigrants from Iraq (13.4%, a difference of 0.090%).
| Demographics | Rating | Rank | Female Poverty |
| Whites/Caucasians | 54.6 /100 | #171 | Average 13.4% |
| Mongolians | 53.6 /100 | #172 | Average 13.4% |
| Immigrants | Afghanistan | 50.8 /100 | #173 | Average 13.4% |
| Immigrants | Iraq | 50.0 /100 | #174 | Average 13.4% |
| Celtics | 49.9 /100 | #175 | Average 13.4% |
| Immigrants | Spain | 49.9 /100 | #176 | Average 13.4% |
| Immigrants | Morocco | 49.4 /100 | #177 | Average 13.4% |
| Israelis | 49.1 /100 | #178 | Average 13.5% |
| Immigrants | Syria | 48.8 /100 | #179 | Average 13.5% |
| South Americans | 44.8 /100 | #180 | Average 13.5% |
| Venezuelans | 44.5 /100 | #181 | Average 13.5% |
| Immigrants | Colombia | 44.5 /100 | #182 | Average 13.5% |
| Kenyans | 43.8 /100 | #183 | Average 13.5% |
| Immigrants | Sierra Leone | 43.2 /100 | #184 | Average 13.5% |
| Immigrants | Cameroon | 42.0 /100 | #185 | Average 13.5% |
Demographics Similar to Sri Lankans by Female Poverty
In terms of female poverty, the demographic groups most similar to Sri Lankans are Albanian (12.7%, a difference of 0.010%), Immigrants from Southern Europe (12.7%, a difference of 0.020%), New Zealander (12.7%, a difference of 0.070%), Immigrants from Russia (12.7%, a difference of 0.090%), and Immigrants from Hungary (12.7%, a difference of 0.17%).
| Demographics | Rating | Rank | Female Poverty |
| Soviet Union | 92.4 /100 | #111 | Exceptional 12.6% |
| Immigrants | Israel | 92.0 /100 | #112 | Exceptional 12.6% |
| Canadians | 92.0 /100 | #113 | Exceptional 12.7% |
| Welsh | 91.6 /100 | #114 | Exceptional 12.7% |
| Puget Sound Salish | 91.5 /100 | #115 | Exceptional 12.7% |
| Immigrants | Russia | 91.2 /100 | #116 | Exceptional 12.7% |
| Immigrants | Southern Europe | 90.9 /100 | #117 | Exceptional 12.7% |
| Sri Lankans | 90.9 /100 | #118 | Exceptional 12.7% |
| Albanians | 90.8 /100 | #119 | Exceptional 12.7% |
| New Zealanders | 90.6 /100 | #120 | Exceptional 12.7% |
| Immigrants | Hungary | 90.3 /100 | #121 | Exceptional 12.7% |
| French Canadians | 90.2 /100 | #122 | Exceptional 12.7% |
| Immigrants | South Eastern Asia | 89.9 /100 | #123 | Excellent 12.7% |
| Immigrants | Norway | 89.3 /100 | #124 | Excellent 12.8% |
| Argentineans | 89.1 /100 | #125 | Excellent 12.8% |