Israeli vs Cherokee Single Father Poverty
COMPARE
Israeli
Cherokee
Single Father Poverty
Single Father Poverty Comparison
Israelis
Cherokee
16.8%
SINGLE FATHER POVERTY
4.6/ 100
METRIC RATING
229th/ 347
METRIC RANK
19.6%
SINGLE FATHER POVERTY
0.0/ 100
METRIC RATING
321st/ 347
METRIC RANK
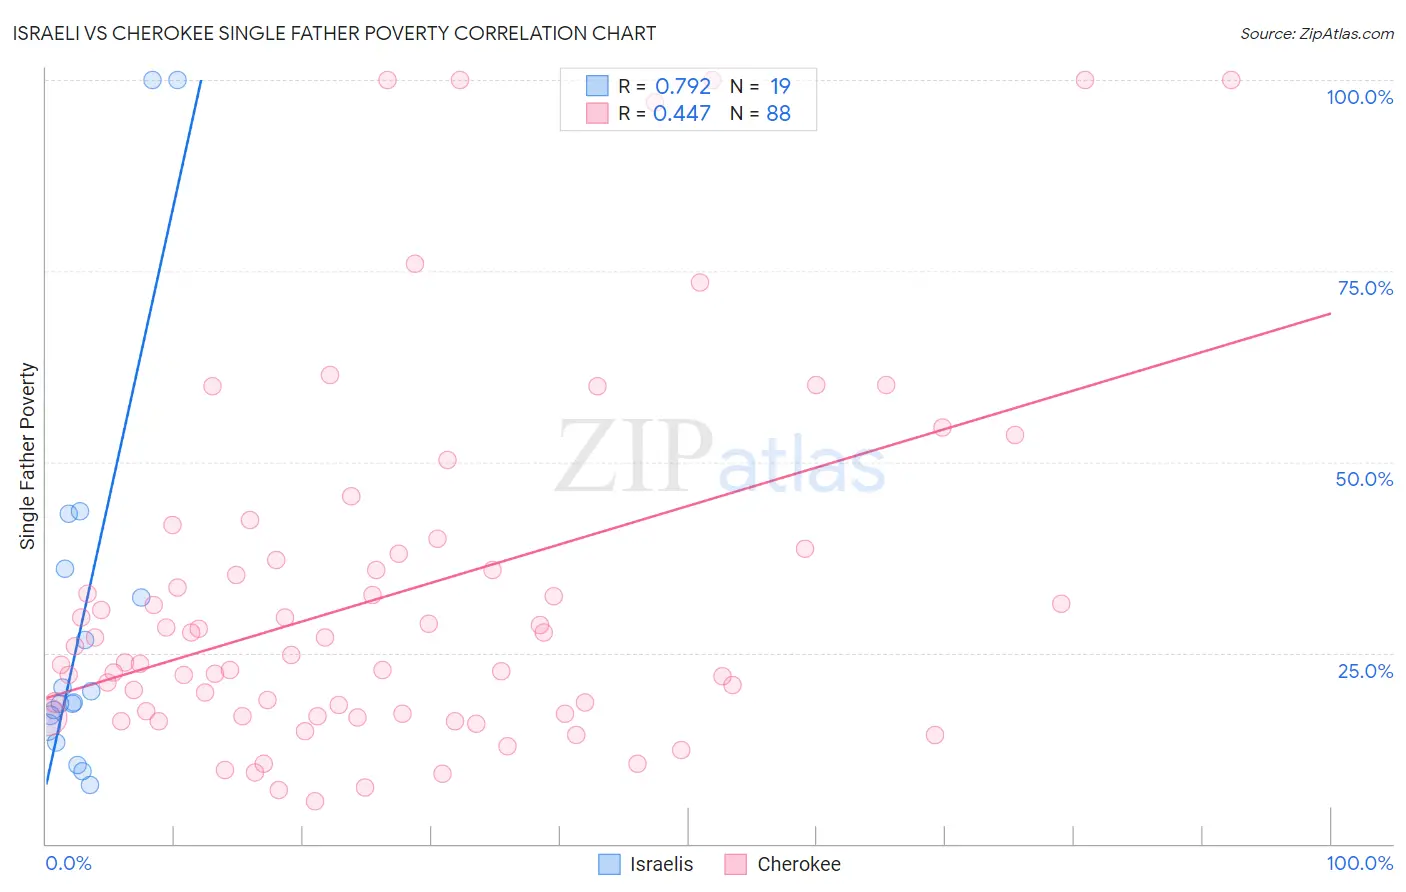
Israeli vs Cherokee Single Father Poverty Correlation Chart
The statistical analysis conducted on geographies consisting of 176,564,274 people shows a strong positive correlation between the proportion of Israelis and poverty level among single fathers in the United States with a correlation coefficient (R) of 0.792 and weighted average of 16.8%. Similarly, the statistical analysis conducted on geographies consisting of 376,598,860 people shows a moderate positive correlation between the proportion of Cherokee and poverty level among single fathers in the United States with a correlation coefficient (R) of 0.447 and weighted average of 19.6%, a difference of 16.6%.
Single Father Poverty Correlation Summary
| Measurement | Israeli | Cherokee |
| Minimum | 7.8% | 5.6% |
| Maximum | 100.0% | 100.0% |
| Range | 92.2% | 94.4% |
| Mean | 29.9% | 32.7% |
| Median | 18.5% | 25.3% |
| Interquartile 25% (IQ1) | 15.2% | 17.1% |
| Interquartile 75% (IQ3) | 35.9% | 37.5% |
| Interquartile Range (IQR) | 20.7% | 20.4% |
| Standard Deviation (Sample) | 26.8% | 23.5% |
| Standard Deviation (Population) | 26.1% | 23.4% |
Similar Demographics by Single Father Poverty
Demographics Similar to Israelis by Single Father Poverty
In terms of single father poverty, the demographic groups most similar to Israelis are Immigrants from Trinidad and Tobago (16.8%, a difference of 0.030%), Belgian (16.8%, a difference of 0.16%), British (16.8%, a difference of 0.22%), Spanish American (16.9%, a difference of 0.24%), and Immigrants from Grenada (16.9%, a difference of 0.26%).
| Demographics | Rating | Rank | Single Father Poverty |
| Immigrants | Spain | 8.0 /100 | #222 | Tragic 16.7% |
| Immigrants | Austria | 7.0 /100 | #223 | Tragic 16.8% |
| Immigrants | Norway | 6.5 /100 | #224 | Tragic 16.8% |
| Menominee | 6.4 /100 | #225 | Tragic 16.8% |
| Hispanics or Latinos | 6.1 /100 | #226 | Tragic 16.8% |
| British | 5.6 /100 | #227 | Tragic 16.8% |
| Belgians | 5.3 /100 | #228 | Tragic 16.8% |
| Israelis | 4.6 /100 | #229 | Tragic 16.8% |
| Immigrants | Trinidad and Tobago | 4.5 /100 | #230 | Tragic 16.8% |
| Spanish Americans | 3.7 /100 | #231 | Tragic 16.9% |
| Immigrants | Grenada | 3.7 /100 | #232 | Tragic 16.9% |
| Senegalese | 3.2 /100 | #233 | Tragic 16.9% |
| Marshallese | 3.1 /100 | #234 | Tragic 16.9% |
| Immigrants | Western Europe | 2.9 /100 | #235 | Tragic 16.9% |
| Immigrants | Germany | 2.9 /100 | #236 | Tragic 16.9% |
Demographics Similar to Cherokee by Single Father Poverty
In terms of single father poverty, the demographic groups most similar to Cherokee are Inupiat (19.5%, a difference of 0.85%), Creek (19.8%, a difference of 1.0%), Slovak (19.3%, a difference of 1.8%), Pennsylvania German (20.0%, a difference of 1.9%), and American (20.1%, a difference of 2.1%).
| Demographics | Rating | Rank | Single Father Poverty |
| Delaware | 0.0 /100 | #314 | Tragic 18.9% |
| Chickasaw | 0.0 /100 | #315 | Tragic 19.0% |
| Osage | 0.0 /100 | #316 | Tragic 19.0% |
| Dominicans | 0.0 /100 | #317 | Tragic 19.1% |
| Dutch West Indians | 0.0 /100 | #318 | Tragic 19.2% |
| Slovaks | 0.0 /100 | #319 | Tragic 19.3% |
| Inupiat | 0.0 /100 | #320 | Tragic 19.5% |
| Cherokee | 0.0 /100 | #321 | Tragic 19.6% |
| Creek | 0.0 /100 | #322 | Tragic 19.8% |
| Pennsylvania Germans | 0.0 /100 | #323 | Tragic 20.0% |
| Americans | 0.0 /100 | #324 | Tragic 20.1% |
| Blacks/African Americans | 0.0 /100 | #325 | Tragic 20.4% |
| Immigrants | Yemen | 0.0 /100 | #326 | Tragic 20.6% |
| Choctaw | 0.0 /100 | #327 | Tragic 20.7% |
| Pueblo | 0.0 /100 | #328 | Tragic 21.1% |