Iraqi vs Immigrants from Saudi Arabia Female Poverty Among 18-24 Year Olds
COMPARE
Iraqi
Immigrants from Saudi Arabia
Female Poverty Among 18-24 Year Olds
Female Poverty Among 18-24 Year Olds Comparison
Iraqis
Immigrants from Saudi Arabia
20.2%
FEMALE POVERTY AMONG 18-24 YEAR OLDS
43.3/ 100
METRIC RATING
180th/ 347
METRIC RANK
25.3%
FEMALE POVERTY AMONG 18-24 YEAR OLDS
0.0/ 100
METRIC RATING
325th/ 347
METRIC RANK
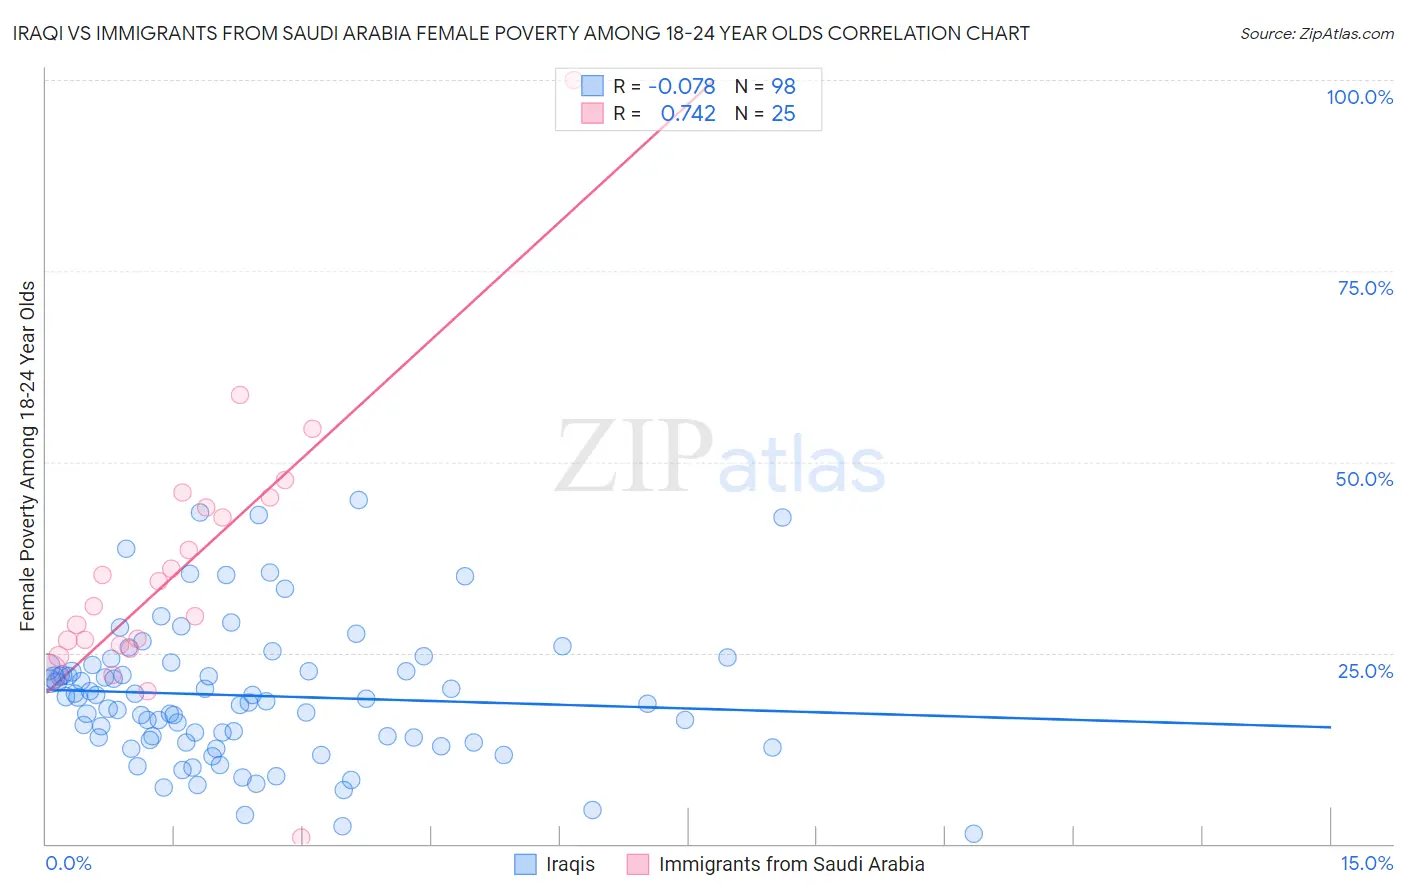
Iraqi vs Immigrants from Saudi Arabia Female Poverty Among 18-24 Year Olds Correlation Chart
The statistical analysis conducted on geographies consisting of 169,269,005 people shows a slight negative correlation between the proportion of Iraqis and poverty level among females between the ages 18 and 24 in the United States with a correlation coefficient (R) of -0.078 and weighted average of 20.2%. Similarly, the statistical analysis conducted on geographies consisting of 163,276,654 people shows a strong positive correlation between the proportion of Immigrants from Saudi Arabia and poverty level among females between the ages 18 and 24 in the United States with a correlation coefficient (R) of 0.742 and weighted average of 25.3%, a difference of 25.4%.
Female Poverty Among 18-24 Year Olds Correlation Summary
| Measurement | Iraqi | Immigrants from Saudi Arabia |
| Minimum | 1.3% | 0.84% |
| Maximum | 45.1% | 100.0% |
| Range | 43.8% | 99.2% |
| Mean | 19.4% | 35.8% |
| Median | 18.9% | 31.1% |
| Interquartile 25% (IQ1) | 13.5% | 25.7% |
| Interquartile 75% (IQ3) | 23.2% | 44.7% |
| Interquartile Range (IQR) | 9.6% | 19.0% |
| Standard Deviation (Sample) | 9.0% | 18.2% |
| Standard Deviation (Population) | 9.0% | 17.9% |
Similar Demographics by Female Poverty Among 18-24 Year Olds
Demographics Similar to Iraqis by Female Poverty Among 18-24 Year Olds
In terms of female poverty among 18-24 year olds, the demographic groups most similar to Iraqis are Ethiopian (20.2%, a difference of 0.020%), Immigrants from China (20.2%, a difference of 0.020%), Immigrants from Barbados (20.2%, a difference of 0.020%), Swiss (20.2%, a difference of 0.030%), and Immigrants from Kazakhstan (20.2%, a difference of 0.040%).
| Demographics | Rating | Rank | Female Poverty Among 18-24 Year Olds |
| Irish | 50.0 /100 | #173 | Average 20.1% |
| Swedes | 50.0 /100 | #174 | Average 20.1% |
| South American Indians | 48.4 /100 | #175 | Average 20.1% |
| Kenyans | 44.9 /100 | #176 | Average 20.2% |
| Immigrants | Kazakhstan | 44.2 /100 | #177 | Average 20.2% |
| Swiss | 44.0 /100 | #178 | Average 20.2% |
| Ethiopians | 43.8 /100 | #179 | Average 20.2% |
| Iraqis | 43.3 /100 | #180 | Average 20.2% |
| Immigrants | China | 43.0 /100 | #181 | Average 20.2% |
| Immigrants | Barbados | 42.8 /100 | #182 | Average 20.2% |
| Lebanese | 40.6 /100 | #183 | Average 20.2% |
| Immigrants | Central America | 39.9 /100 | #184 | Fair 20.2% |
| Nepalese | 39.7 /100 | #185 | Fair 20.2% |
| Immigrants | Ethiopia | 37.3 /100 | #186 | Fair 20.2% |
| Immigrants | Mexico | 36.3 /100 | #187 | Fair 20.2% |
Demographics Similar to Immigrants from Saudi Arabia by Female Poverty Among 18-24 Year Olds
In terms of female poverty among 18-24 year olds, the demographic groups most similar to Immigrants from Saudi Arabia are Yakama (25.3%, a difference of 0.25%), German Russian (25.2%, a difference of 0.43%), Arapaho (25.2%, a difference of 0.46%), Ute (25.4%, a difference of 0.48%), and Somali (25.1%, a difference of 0.53%).
| Demographics | Rating | Rank | Female Poverty Among 18-24 Year Olds |
| Chickasaw | 0.0 /100 | #318 | Tragic 24.5% |
| Dutch West Indians | 0.0 /100 | #319 | Tragic 24.5% |
| Immigrants | Congo | 0.0 /100 | #320 | Tragic 24.6% |
| Immigrants | Zaire | 0.0 /100 | #321 | Tragic 25.1% |
| Somalis | 0.0 /100 | #322 | Tragic 25.1% |
| Arapaho | 0.0 /100 | #323 | Tragic 25.2% |
| German Russians | 0.0 /100 | #324 | Tragic 25.2% |
| Immigrants | Saudi Arabia | 0.0 /100 | #325 | Tragic 25.3% |
| Yakama | 0.0 /100 | #326 | Tragic 25.3% |
| Ute | 0.0 /100 | #327 | Tragic 25.4% |
| Natives/Alaskans | 0.0 /100 | #328 | Tragic 25.4% |
| Cajuns | 0.0 /100 | #329 | Tragic 25.7% |
| Immigrants | Somalia | 0.0 /100 | #330 | Tragic 25.7% |
| Chippewa | 0.0 /100 | #331 | Tragic 25.9% |
| Houma | 0.0 /100 | #332 | Tragic 26.2% |