Iranian vs Lithuanian Female Poverty Among 18-24 Year Olds
COMPARE
Iranian
Lithuanian
Female Poverty Among 18-24 Year Olds
Female Poverty Among 18-24 Year Olds Comparison
Iranians
Lithuanians
20.1%
FEMALE POVERTY AMONG 18-24 YEAR OLDS
54.7/ 100
METRIC RATING
170th/ 347
METRIC RANK
18.7%
FEMALE POVERTY AMONG 18-24 YEAR OLDS
99.7/ 100
METRIC RATING
73rd/ 347
METRIC RANK
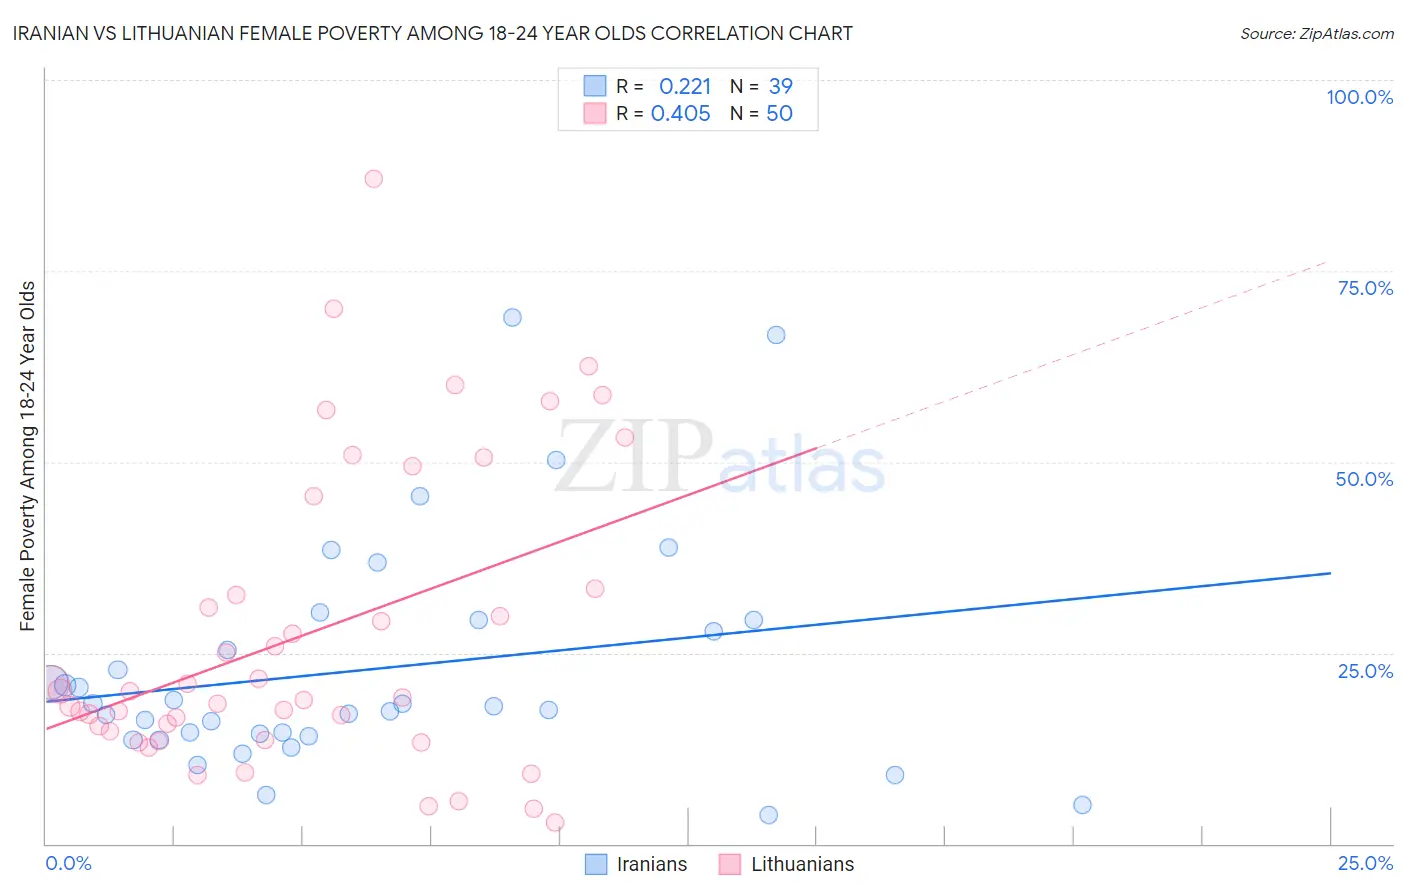
Iranian vs Lithuanian Female Poverty Among 18-24 Year Olds Correlation Chart
The statistical analysis conducted on geographies consisting of 310,982,905 people shows a weak positive correlation between the proportion of Iranians and poverty level among females between the ages 18 and 24 in the United States with a correlation coefficient (R) of 0.221 and weighted average of 20.1%. Similarly, the statistical analysis conducted on geographies consisting of 405,735,156 people shows a moderate positive correlation between the proportion of Lithuanians and poverty level among females between the ages 18 and 24 in the United States with a correlation coefficient (R) of 0.405 and weighted average of 18.7%, a difference of 7.3%.
Female Poverty Among 18-24 Year Olds Correlation Summary
| Measurement | Iranian | Lithuanian |
| Minimum | 3.8% | 2.8% |
| Maximum | 69.0% | 87.0% |
| Range | 65.1% | 84.2% |
| Mean | 22.8% | 27.5% |
| Median | 18.0% | 19.6% |
| Interquartile 25% (IQ1) | 14.0% | 14.8% |
| Interquartile 75% (IQ3) | 29.3% | 33.3% |
| Interquartile Range (IQR) | 15.2% | 18.6% |
| Standard Deviation (Sample) | 14.9% | 19.6% |
| Standard Deviation (Population) | 14.7% | 19.4% |
Similar Demographics by Female Poverty Among 18-24 Year Olds
Demographics Similar to Iranians by Female Poverty Among 18-24 Year Olds
In terms of female poverty among 18-24 year olds, the demographic groups most similar to Iranians are Immigrants from Nigeria (20.1%, a difference of 0.020%), Hmong (20.0%, a difference of 0.040%), Belizean (20.1%, a difference of 0.13%), Fijian (20.0%, a difference of 0.22%), and Irish (20.1%, a difference of 0.23%).
| Demographics | Rating | Rank | Female Poverty Among 18-24 Year Olds |
| Malaysians | 72.7 /100 | #163 | Good 19.9% |
| Central Americans | 70.0 /100 | #164 | Good 19.9% |
| Eastern Europeans | 69.3 /100 | #165 | Good 19.9% |
| Belgians | 69.1 /100 | #166 | Good 19.9% |
| Czechoslovakians | 61.8 /100 | #167 | Good 20.0% |
| Fijians | 59.1 /100 | #168 | Average 20.0% |
| Hmong | 55.4 /100 | #169 | Average 20.0% |
| Iranians | 54.7 /100 | #170 | Average 20.1% |
| Immigrants | Nigeria | 54.3 /100 | #171 | Average 20.1% |
| Belizeans | 52.0 /100 | #172 | Average 20.1% |
| Irish | 50.0 /100 | #173 | Average 20.1% |
| Swedes | 50.0 /100 | #174 | Average 20.1% |
| South American Indians | 48.4 /100 | #175 | Average 20.1% |
| Kenyans | 44.9 /100 | #176 | Average 20.2% |
| Immigrants | Kazakhstan | 44.2 /100 | #177 | Average 20.2% |
Demographics Similar to Lithuanians by Female Poverty Among 18-24 Year Olds
In terms of female poverty among 18-24 year olds, the demographic groups most similar to Lithuanians are Armenian (18.7%, a difference of 0.040%), Immigrants from Haiti (18.7%, a difference of 0.060%), Immigrants from Costa Rica (18.7%, a difference of 0.12%), Hawaiian (18.7%, a difference of 0.19%), and Immigrants from Bulgaria (18.6%, a difference of 0.23%).
| Demographics | Rating | Rank | Female Poverty Among 18-24 Year Olds |
| Jordanians | 99.8 /100 | #66 | Exceptional 18.6% |
| Immigrants | Korea | 99.8 /100 | #67 | Exceptional 18.6% |
| Brazilians | 99.8 /100 | #68 | Exceptional 18.6% |
| Immigrants | Bulgaria | 99.7 /100 | #69 | Exceptional 18.6% |
| Immigrants | Costa Rica | 99.7 /100 | #70 | Exceptional 18.7% |
| Immigrants | Haiti | 99.7 /100 | #71 | Exceptional 18.7% |
| Armenians | 99.7 /100 | #72 | Exceptional 18.7% |
| Lithuanians | 99.7 /100 | #73 | Exceptional 18.7% |
| Hawaiians | 99.6 /100 | #74 | Exceptional 18.7% |
| Poles | 99.6 /100 | #75 | Exceptional 18.8% |
| Immigrants | Cambodia | 99.5 /100 | #76 | Exceptional 18.8% |
| Costa Ricans | 99.5 /100 | #77 | Exceptional 18.8% |
| Immigrants | Europe | 99.5 /100 | #78 | Exceptional 18.8% |
| Uruguayans | 99.5 /100 | #79 | Exceptional 18.8% |
| Palestinians | 99.5 /100 | #80 | Exceptional 18.8% |