Iranian vs Austrian Child Poverty Among Girls Under 16

COMPARE

Iranian
Race
Ancestry
AfghanAfricanAlaska NativeAlaskan AthabascanAlbanianAleutAlsatianAmericanApacheArabArapahoArgentineanArmenianAssyrian/Chaldean/SyriacAustralianBahamianBangladeshiBarbadianBasqueBelgianBelizeanBermudanBhutaneseBlackfeetBolivianBrazilianBritishBritish West IndianBulgarianBurmeseCajunCambodianCanadianCape VerdeanCarpatho RusynCelticCentral AmericanCentral American IndianCherokeeCheyenneChickasawChileanChineseChippewaChoctawColombianColvilleComancheCosta RicanCreeCreekCroatianCrowCubanCypriotCzechCzechoslovakianDanishDelawareDominicanDutchDutch West IndianEastern EuropeanEcuadorianEgyptianEnglishEstonianEthiopianEuropeanFijianFilipinoFinnishFrenchFrench American IndianFrench CanadianGermanGerman RussianGhanaianGreekGuamanian/ChamorroGuatemalanGuyaneseHaitianHmongHonduranHopiHoumaHungarianIcelanderIndian (Asian)IndonesianInupiatIranianIraqiIrishIroquoisIsraeliItalianJamaicanJapaneseJordanianKenyanKiowaKoreanLaotianLatvianLebaneseLiberianLithuanianLumbeeLuxembourgerMacedonianMalaysianMalteseMarshalleseMenomineeMexicanMexican American IndianMongolianMoroccanNative HawaiianNavajoNepaleseNew ZealanderNicaraguanNigerianNorthern EuropeanNorwegianOkinawanOsageOttawaPaiutePakistaniPalestinianPanamanianParaguayanPennsylvania GermanPeruvianPimaPolishPortuguesePotawatomiPuebloPuerto RicanPuget Sound SalishRomanianRussianSalvadoranSamoanScandinavianScotch-IrishScottishSeminoleSenegaleseSerbianShoshoneSierra LeoneanSiouxSlavicSlovakSloveneSomaliSouth AfricanSouth AmericanSouth American IndianSoviet UnionSpaniardSpanishSpanish AmericanSpanish American IndianSri LankanSubsaharan AfricanSudaneseSwedishSwissSyrianTaiwaneseThaiTlingit-HaidaTohono O'OdhamTonganTrinidadian and TobagonianTsimshianTurkishU.S. Virgin IslanderUgandanUkrainianUruguayanUteVenezuelanVietnameseWelshWest IndianYakamaYaquiYugoslavianYumanYup'ikZimbabwean
Immigration
NonimmigrantsImmigrantsAfghanistanAfricaAlbaniaArgentinaArmeniaAsiaAustraliaAustriaBahamasBangladeshBarbadosBelarusBelgiumBelizeBoliviaBosnia and HerzegovinaBrazilBulgariaBurma/MyanmarCabo VerdeCambodiaCameroonCanadaCaribbeanCentral AmericaChileChinaColombiaCongoCosta RicaCroatiaCubaCzechoslovakiaDenmarkDominicaDominican RepublicEastern AfricaEastern AsiaEastern EuropeEcuadorEgyptEl SalvadorEnglandEritreaEthiopiaEuropeFijiFranceGermanyGhanaGreeceGrenadaGuatemalaGuyanaHaitiHondurasHong KongHungaryIndiaIndonesiaIranIraqIrelandIsraelItalyJamaicaJapanJordanKazakhstanKenyaKoreaKuwaitLaosLatin AmericaLatviaLebanonLiberiaLithuaniaMalaysiaMexicoMicronesiaMiddle AfricaMoldovaMoroccoNepalNetherlandsNicaraguaNigeriaNorth AmericaNorth MacedoniaNorthern AfricaNorthern EuropeNorwayOceaniaPakistanPanamaPeruPhilippinesPolandPortugalRomaniaRussiaSaudi ArabiaScotlandSenegalSerbiaSierra LeoneSingaporeSomaliaSouth AfricaSouth AmericaSouth Central AsiaSouth Eastern AsiaSouthern EuropeSpainSri LankaSt. Vincent and the GrenadinesSudanSwedenSwitzerlandSyriaTaiwanThailandTrinidad and TobagoTurkeyUgandaUkraineUruguayUzbekistanVenezuelaVietnamWest IndiesWestern AfricaWestern AsiaWestern EuropeYemenZaireZimbabweAzores
Austrian
Race
Ancestry
AfghanAfricanAlaska NativeAlaskan AthabascanAlbanianAleutAlsatianAmericanApacheArabArapahoArgentineanArmenianAssyrian/Chaldean/SyriacAustralianAustrianBahamianBangladeshiBarbadianBasqueBelgianBelizeanBermudanBhutaneseBlackfeetBolivianBrazilianBritishBritish West IndianBulgarianBurmeseCajunCambodianCanadianCape VerdeanCarpatho RusynCelticCentral AmericanCentral American IndianCherokeeCheyenneChickasawChileanChineseChippewaChoctawColombianColvilleComancheCosta RicanCreeCreekCroatianCrowCubanCypriotCzechCzechoslovakianDanishDelawareDominicanDutchDutch West IndianEastern EuropeanEcuadorianEgyptianEnglishEstonianEthiopianEuropeanFijianFilipinoFinnishFrenchFrench American IndianFrench CanadianGermanGerman RussianGhanaianGreekGuamanian/ChamorroGuatemalanGuyaneseHaitianHmongHonduranHopiHoumaHungarianIcelanderIndian (Asian)IndonesianInupiatIraqiIrishIroquoisIsraeliItalianJamaicanJapaneseJordanianKenyanKiowaKoreanLaotianLatvianLebaneseLiberianLithuanianLumbeeLuxembourgerMacedonianMalaysianMalteseMarshalleseMenomineeMexicanMexican American IndianMongolianMoroccanNative HawaiianNavajoNepaleseNew ZealanderNicaraguanNigerianNorthern EuropeanNorwegianOkinawanOsageOttawaPaiutePakistaniPalestinianPanamanianParaguayanPennsylvania GermanPeruvianPimaPolishPortuguesePotawatomiPuebloPuerto RicanPuget Sound SalishRomanianRussianSalvadoranSamoanScandinavianScotch-IrishScottishSeminoleSenegaleseSerbianShoshoneSierra LeoneanSiouxSlavicSlovakSloveneSomaliSouth AfricanSouth AmericanSouth American IndianSoviet UnionSpaniardSpanishSpanish AmericanSpanish American IndianSri LankanSubsaharan AfricanSudaneseSwedishSwissSyrianTaiwaneseThaiTlingit-HaidaTohono O'OdhamTonganTrinidadian and TobagonianTsimshianTurkishU.S. Virgin IslanderUgandanUkrainianUruguayanUteVenezuelanVietnameseWelshWest IndianYakamaYaquiYugoslavianYumanYup'ikZimbabwean
Immigration
NonimmigrantsImmigrantsAfghanistanAfricaAlbaniaArgentinaArmeniaAsiaAustraliaAustriaBahamasBangladeshBarbadosBelarusBelgiumBelizeBoliviaBosnia and HerzegovinaBrazilBulgariaBurma/MyanmarCabo VerdeCambodiaCameroonCanadaCaribbeanCentral AmericaChileChinaColombiaCongoCosta RicaCroatiaCubaCzechoslovakiaDenmarkDominicaDominican RepublicEastern AfricaEastern AsiaEastern EuropeEcuadorEgyptEl SalvadorEnglandEritreaEthiopiaEuropeFijiFranceGermanyGhanaGreeceGrenadaGuatemalaGuyanaHaitiHondurasHong KongHungaryIndiaIndonesiaIranIraqIrelandIsraelItalyJamaicaJapanJordanKazakhstanKenyaKoreaKuwaitLaosLatin AmericaLatviaLebanonLiberiaLithuaniaMalaysiaMexicoMicronesiaMiddle AfricaMoldovaMoroccoNepalNetherlandsNicaraguaNigeriaNorth AmericaNorth MacedoniaNorthern AfricaNorthern EuropeNorwayOceaniaPakistanPanamaPeruPhilippinesPolandPortugalRomaniaRussiaSaudi ArabiaScotlandSenegalSerbiaSierra LeoneSingaporeSomaliaSouth AfricaSouth AmericaSouth Central AsiaSouth Eastern AsiaSouthern EuropeSpainSri LankaSt. Vincent and the GrenadinesSudanSwedenSwitzerlandSyriaTaiwanThailandTrinidad and TobagoTurkeyUgandaUkraineUruguayUzbekistanVenezuelaVietnamWest IndiesWestern AfricaWestern AsiaWestern EuropeYemenZaireZimbabweAzores
Child Poverty Among Girls Under 16
Income
Poverty
Unemployment
Labor Participation
Family Structure
Vehicle Availability
Education Level
Disability

Child Poverty Among Girls Under 16 Comparison

Iranians

Austrians

Exceptional
Exceptional
12.4%
CHILD POVERTY AMONG GIRLS UNDER 16
100.0/ 100
METRIC RATING
8th/ 347
METRIC RANK
14.9%
CHILD POVERTY AMONG GIRLS UNDER 16
96.7/ 100
METRIC RATING
92nd/ 347
METRIC RANK

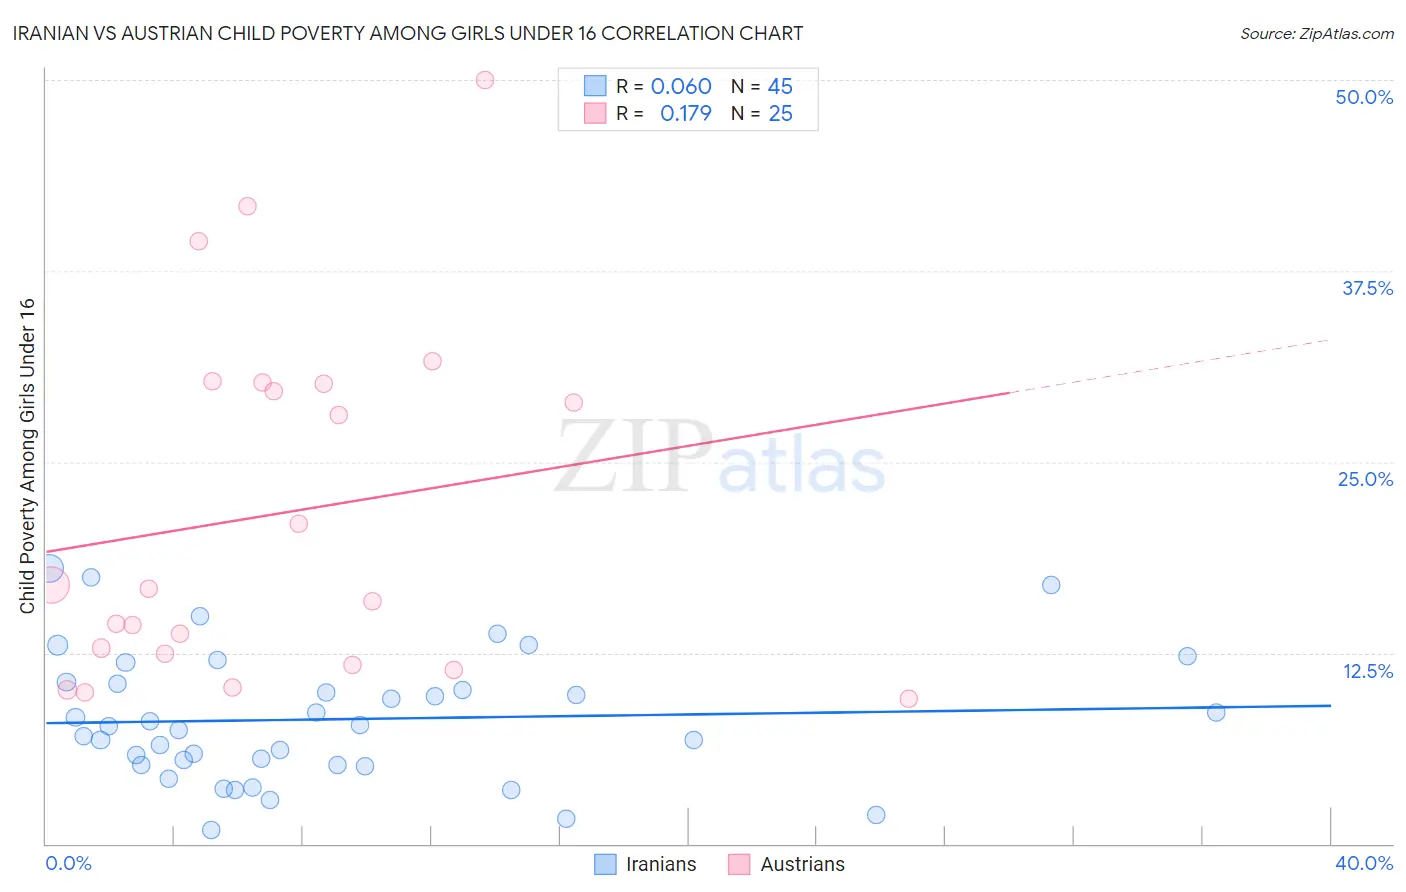
Iranian vs Austrian Child Poverty Among Girls Under 16 Correlation Chart

The statistical analysis conducted on geographies consisting of 311,679,854 people shows a slight positive correlation between the proportion of Iranians and poverty level among girls under the age of 16 in the United States with a correlation coefficient (R) of 0.060 and weighted average of 12.4%. Similarly, the statistical analysis conducted on geographies consisting of 439,542,815 people shows a poor positive correlation between the proportion of Austrians and poverty level among girls under the age of 16 in the United States with a correlation coefficient (R) of 0.179 and weighted average of 14.9%, a difference of 19.9%.
Iranian vs Austrian Child Poverty Among Girls Under 16

Child Poverty Among Girls Under 16 Correlation Summary

MeasurementIranianAustrian
Minimum0.88%9.5%
Maximum18.0%50.0%
Range17.1%40.5%
Mean8.2%21.6%
Median7.7%16.7%
Interquartile 25% (IQ1)5.2%12.1%
Interquartile 75% (IQ3)10.5%30.2%
Interquartile Range (IQR)5.3%18.1%
Standard Deviation (Sample)4.2%11.5%
Standard Deviation (Population)4.2%11.3%

Similar Demographics by Child Poverty Among Girls Under 16

Demographics Similar to Iranians by Child Poverty Among Girls Under 16

In terms of child poverty among girls under 16, the demographic groups most similar to Iranians are Immigrants from Singapore (12.5%, a difference of 0.43%), Chinese (12.3%, a difference of 0.53%), Immigrants from Hong Kong (12.3%, a difference of 0.66%), Immigrants from Iran (12.6%, a difference of 1.4%), and Immigrants from South Central Asia (12.7%, a difference of 2.6%).
DemographicsRating | RankChild Poverty Among Girls Under 16
Immigrants | India
100.0
/100
|
#1
Exceptional
11.0%
Immigrants | Taiwan
100.0
/100
|
#2
Exceptional
11.3%
Filipinos
100.0
/100
|
#3
Exceptional
11.4%
Tsimshian
100.0
/100
|
#4
Exceptional
11.5%
Thais
100.0
/100
|
#5
Exceptional
11.8%
Immigrants | Hong Kong
100.0
/100
|
#6
Exceptional
12.3%
Chinese
100.0
/100
|
#7
Exceptional
12.3%
Iranians
100.0
/100
|
#8
Exceptional
12.4%
Immigrants | Singapore
100.0
/100
|
#9
Exceptional
12.5%
Immigrants | Iran
100.0
/100
|
#10
Exceptional
12.6%
Immigrants | South Central Asia
100.0
/100
|
#11
Exceptional
12.7%
Bhutanese
100.0
/100
|
#12
Exceptional
12.7%
Immigrants | Ireland
99.9
/100
|
#13
Exceptional
12.9%
Burmese
99.9
/100
|
#14
Exceptional
13.0%
Okinawans
99.9
/100
|
#15
Exceptional
13.0%

Demographics Similar to Austrians by Child Poverty Among Girls Under 16

In terms of child poverty among girls under 16, the demographic groups most similar to Austrians are Immigrants from North America (14.9%, a difference of 0.070%), Immigrants from Switzerland (14.9%, a difference of 0.34%), Immigrants from Belarus (14.8%, a difference of 0.35%), German (14.9%, a difference of 0.36%), and Northern European (14.8%, a difference of 0.39%).
DemographicsRating | RankChild Poverty Among Girls Under 16
Swiss
97.2
/100
|
#85
Exceptional
14.8%
Australians
97.2
/100
|
#86
Exceptional
14.8%
Finns
97.2
/100
|
#87
Exceptional
14.8%
Immigrants | Canada
97.1
/100
|
#88
Exceptional
14.8%
Jordanians
97.1
/100
|
#89
Exceptional
14.8%
Northern Europeans
97.0
/100
|
#90
Exceptional
14.8%
Immigrants | Belarus
97.0
/100
|
#91
Exceptional
14.8%
Austrians
96.7
/100
|
#92
Exceptional
14.9%
Immigrants | North America
96.6
/100
|
#93
Exceptional
14.9%
Immigrants | Switzerland
96.3
/100
|
#94
Exceptional
14.9%
Germans
96.3
/100
|
#95
Exceptional
14.9%
Immigrants | France
96.2
/100
|
#96
Exceptional
14.9%
Immigrants | Latvia
96.1
/100
|
#97
Exceptional
14.9%
Basques
95.9
/100
|
#98
Exceptional
15.0%
Immigrants | Egypt
95.7
/100
|
#99
Exceptional
15.0%