Inupiat vs Spanish American Indian Female Poverty Among 18-24 Year Olds
COMPARE
Inupiat
Spanish American Indian
Female Poverty Among 18-24 Year Olds
Female Poverty Among 18-24 Year Olds Comparison
Inupiat
Spanish American Indians
22.6%
FEMALE POVERTY AMONG 18-24 YEAR OLDS
0.0/ 100
METRIC RATING
297th/ 347
METRIC RANK
18.1%
FEMALE POVERTY AMONG 18-24 YEAR OLDS
100.0/ 100
METRIC RATING
45th/ 347
METRIC RANK
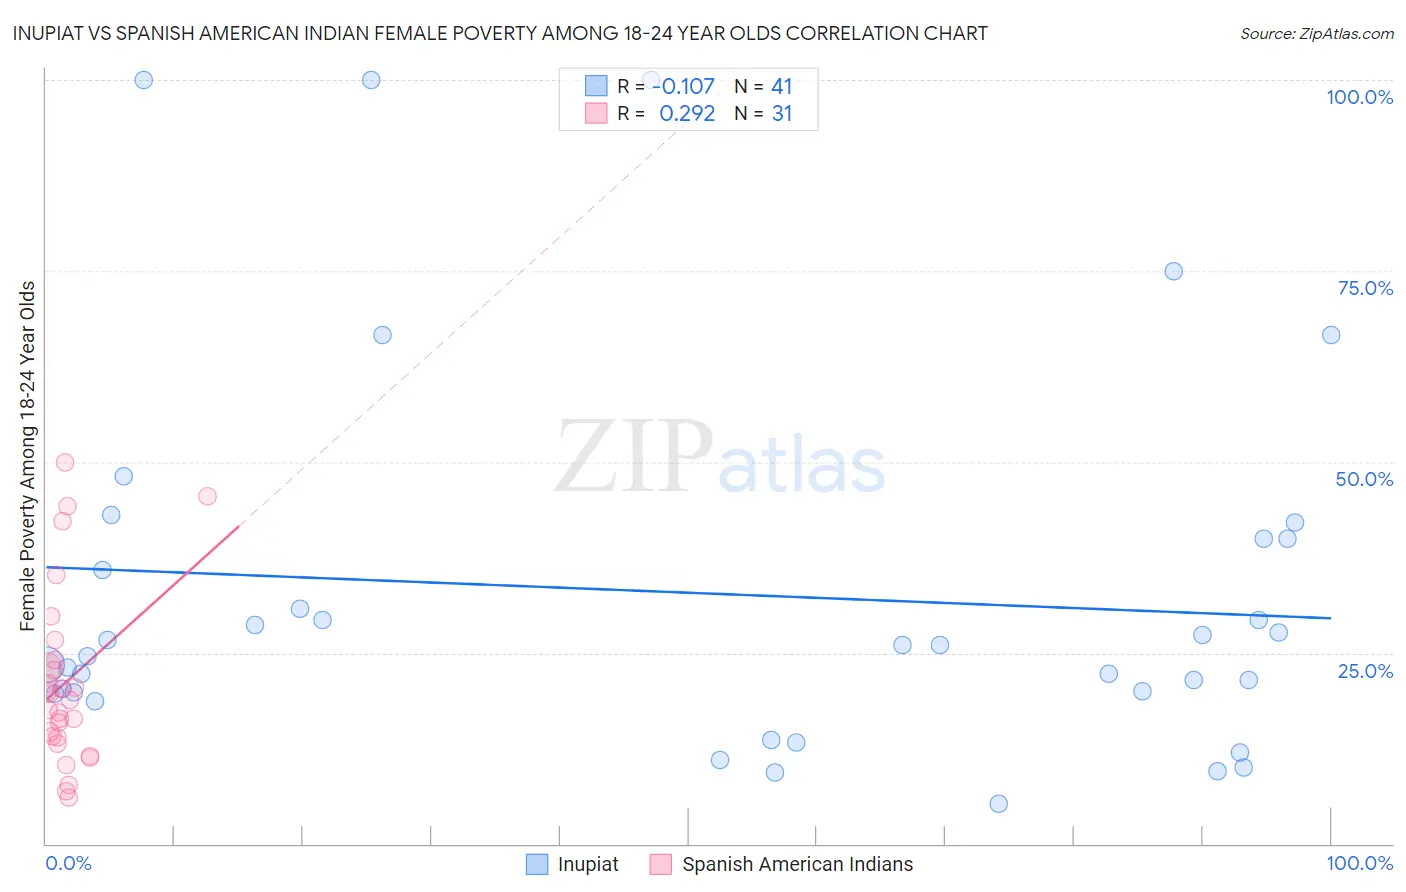
Inupiat vs Spanish American Indian Female Poverty Among 18-24 Year Olds Correlation Chart
The statistical analysis conducted on geographies consisting of 95,768,786 people shows a poor negative correlation between the proportion of Inupiat and poverty level among females between the ages 18 and 24 in the United States with a correlation coefficient (R) of -0.107 and weighted average of 22.6%. Similarly, the statistical analysis conducted on geographies consisting of 73,008,274 people shows a weak positive correlation between the proportion of Spanish American Indians and poverty level among females between the ages 18 and 24 in the United States with a correlation coefficient (R) of 0.292 and weighted average of 18.1%, a difference of 24.6%.
Female Poverty Among 18-24 Year Olds Correlation Summary
| Measurement | Inupiat | Spanish American Indian |
| Minimum | 5.2% | 6.0% |
| Maximum | 100.0% | 50.0% |
| Range | 94.8% | 44.0% |
| Mean | 32.9% | 21.2% |
| Median | 26.0% | 18.8% |
| Interquartile 25% (IQ1) | 19.7% | 13.8% |
| Interquartile 75% (IQ3) | 40.0% | 24.0% |
| Interquartile Range (IQR) | 20.3% | 10.1% |
| Standard Deviation (Sample) | 24.5% | 11.5% |
| Standard Deviation (Population) | 24.2% | 11.3% |
Similar Demographics by Female Poverty Among 18-24 Year Olds
Demographics Similar to Inupiat by Female Poverty Among 18-24 Year Olds
In terms of female poverty among 18-24 year olds, the demographic groups most similar to Inupiat are Central American Indian (22.6%, a difference of 0.070%), Menominee (22.5%, a difference of 0.14%), Shoshone (22.5%, a difference of 0.25%), Indonesian (22.5%, a difference of 0.37%), and U.S. Virgin Islander (22.5%, a difference of 0.41%).
| Demographics | Rating | Rank | Female Poverty Among 18-24 Year Olds |
| Immigrants | Senegal | 0.0 /100 | #290 | Tragic 22.4% |
| Bangladeshis | 0.0 /100 | #291 | Tragic 22.5% |
| Alaskan Athabascans | 0.0 /100 | #292 | Tragic 22.5% |
| U.S. Virgin Islanders | 0.0 /100 | #293 | Tragic 22.5% |
| Indonesians | 0.0 /100 | #294 | Tragic 22.5% |
| Shoshone | 0.0 /100 | #295 | Tragic 22.5% |
| Menominee | 0.0 /100 | #296 | Tragic 22.5% |
| Inupiat | 0.0 /100 | #297 | Tragic 22.6% |
| Central American Indians | 0.0 /100 | #298 | Tragic 22.6% |
| Cherokee | 0.0 /100 | #299 | Tragic 22.7% |
| Africans | 0.0 /100 | #300 | Tragic 22.8% |
| Seminole | 0.0 /100 | #301 | Tragic 22.9% |
| Iroquois | 0.0 /100 | #302 | Tragic 22.9% |
| Senegalese | 0.0 /100 | #303 | Tragic 23.0% |
| Sudanese | 0.0 /100 | #304 | Tragic 23.0% |
Demographics Similar to Spanish American Indians by Female Poverty Among 18-24 Year Olds
In terms of female poverty among 18-24 year olds, the demographic groups most similar to Spanish American Indians are Nicaraguan (18.1%, a difference of 0.090%), Macedonian (18.1%, a difference of 0.17%), Bulgarian (18.1%, a difference of 0.18%), Immigrants from Southern Europe (18.2%, a difference of 0.28%), and Asian (18.2%, a difference of 0.37%).
| Demographics | Rating | Rank | Female Poverty Among 18-24 Year Olds |
| South Americans | 100.0 /100 | #38 | Exceptional 18.0% |
| Puget Sound Salish | 100.0 /100 | #39 | Exceptional 18.0% |
| Immigrants | Romania | 100.0 /100 | #40 | Exceptional 18.0% |
| Immigrants | Argentina | 100.0 /100 | #41 | Exceptional 18.0% |
| Bulgarians | 100.0 /100 | #42 | Exceptional 18.1% |
| Macedonians | 100.0 /100 | #43 | Exceptional 18.1% |
| Nicaraguans | 100.0 /100 | #44 | Exceptional 18.1% |
| Spanish American Indians | 100.0 /100 | #45 | Exceptional 18.1% |
| Immigrants | Southern Europe | 100.0 /100 | #46 | Exceptional 18.2% |
| Asians | 100.0 /100 | #47 | Exceptional 18.2% |
| Sri Lankans | 100.0 /100 | #48 | Exceptional 18.2% |
| Bhutanese | 100.0 /100 | #49 | Exceptional 18.2% |
| Samoans | 100.0 /100 | #50 | Exceptional 18.2% |
| Immigrants | Eastern Europe | 99.9 /100 | #51 | Exceptional 18.2% |
| Immigrants | Ireland | 99.9 /100 | #52 | Exceptional 18.3% |