Indonesian vs Yugoslavian Child Poverty Among Boys Under 16
COMPARE
Indonesian
Yugoslavian
Child Poverty Among Boys Under 16
Child Poverty Among Boys Under 16 Comparison
Indonesians
Yugoslavians
20.8%
CHILD POVERTY AMONG BOYS UNDER 16
0.0/ 100
METRIC RATING
296th/ 347
METRIC RANK
15.9%
CHILD POVERTY AMONG BOYS UNDER 16
75.9/ 100
METRIC RATING
158th/ 347
METRIC RANK
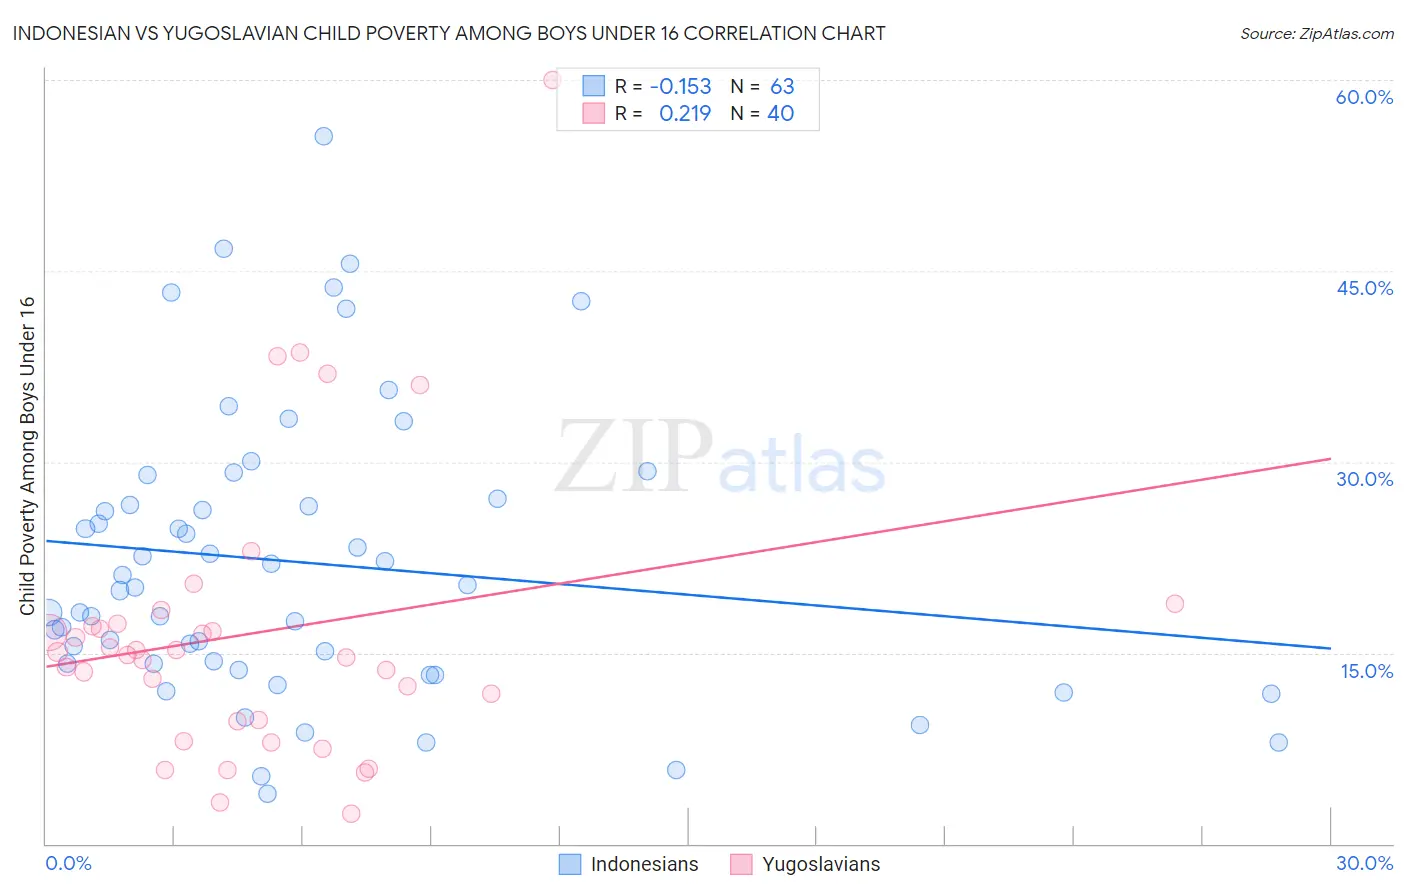
Indonesian vs Yugoslavian Child Poverty Among Boys Under 16 Correlation Chart
The statistical analysis conducted on geographies consisting of 161,767,910 people shows a poor negative correlation between the proportion of Indonesians and poverty level among boys under the age of 16 in the United States with a correlation coefficient (R) of -0.153 and weighted average of 20.8%. Similarly, the statistical analysis conducted on geographies consisting of 282,204,208 people shows a weak positive correlation between the proportion of Yugoslavians and poverty level among boys under the age of 16 in the United States with a correlation coefficient (R) of 0.219 and weighted average of 15.9%, a difference of 30.7%.
Child Poverty Among Boys Under 16 Correlation Summary
| Measurement | Indonesian | Yugoslavian |
| Minimum | 3.9% | 2.4% |
| Maximum | 55.6% | 60.0% |
| Range | 51.7% | 57.6% |
| Mean | 22.1% | 16.6% |
| Median | 20.1% | 14.9% |
| Interquartile 25% (IQ1) | 14.1% | 9.7% |
| Interquartile 75% (IQ3) | 27.1% | 17.2% |
| Interquartile Range (IQR) | 13.0% | 7.5% |
| Standard Deviation (Sample) | 11.3% | 11.3% |
| Standard Deviation (Population) | 11.2% | 11.1% |
Similar Demographics by Child Poverty Among Boys Under 16
Demographics Similar to Indonesians by Child Poverty Among Boys Under 16
In terms of child poverty among boys under 16, the demographic groups most similar to Indonesians are Mexican (20.7%, a difference of 0.20%), Immigrants from Bahamas (20.7%, a difference of 0.32%), Immigrants from Senegal (20.7%, a difference of 0.44%), Yaqui (20.7%, a difference of 0.45%), and Hispanic or Latino (20.9%, a difference of 0.61%).
| Demographics | Rating | Rank | Child Poverty Among Boys Under 16 |
| Blackfeet | 0.0 /100 | #289 | Tragic 20.4% |
| Senegalese | 0.0 /100 | #290 | Tragic 20.6% |
| Immigrants | Latin America | 0.0 /100 | #291 | Tragic 20.6% |
| Yaqui | 0.0 /100 | #292 | Tragic 20.7% |
| Immigrants | Senegal | 0.0 /100 | #293 | Tragic 20.7% |
| Immigrants | Bahamas | 0.0 /100 | #294 | Tragic 20.7% |
| Mexicans | 0.0 /100 | #295 | Tragic 20.7% |
| Indonesians | 0.0 /100 | #296 | Tragic 20.8% |
| Hispanics or Latinos | 0.0 /100 | #297 | Tragic 20.9% |
| Chippewa | 0.0 /100 | #298 | Tragic 21.0% |
| Immigrants | Caribbean | 0.0 /100 | #299 | Tragic 21.0% |
| Haitians | 0.0 /100 | #300 | Tragic 21.0% |
| Guatemalans | 0.0 /100 | #301 | Tragic 21.1% |
| Somalis | 0.0 /100 | #302 | Tragic 21.1% |
| Immigrants | Haiti | 0.0 /100 | #303 | Tragic 21.3% |
Demographics Similar to Yugoslavians by Child Poverty Among Boys Under 16
In terms of child poverty among boys under 16, the demographic groups most similar to Yugoslavians are Immigrants from Nepal (15.9%, a difference of 0.010%), Israeli (15.9%, a difference of 0.10%), French Canadian (15.9%, a difference of 0.11%), Immigrants from Chile (15.9%, a difference of 0.17%), and Syrian (15.9%, a difference of 0.26%).
| Demographics | Rating | Rank | Child Poverty Among Boys Under 16 |
| Puget Sound Salish | 79.8 /100 | #151 | Good 15.8% |
| Immigrants | Venezuela | 79.5 /100 | #152 | Good 15.8% |
| French | 78.7 /100 | #153 | Good 15.8% |
| Syrians | 77.5 /100 | #154 | Good 15.9% |
| French Canadians | 76.6 /100 | #155 | Good 15.9% |
| Israelis | 76.5 /100 | #156 | Good 15.9% |
| Immigrants | Nepal | 76.0 /100 | #157 | Good 15.9% |
| Yugoslavians | 75.9 /100 | #158 | Good 15.9% |
| Immigrants | Chile | 74.8 /100 | #159 | Good 15.9% |
| Immigrants | Northern Africa | 71.3 /100 | #160 | Good 16.0% |
| Immigrants | Oceania | 71.3 /100 | #161 | Good 16.0% |
| Guamanians/Chamorros | 69.6 /100 | #162 | Good 16.1% |
| Costa Ricans | 68.1 /100 | #163 | Good 16.1% |
| Immigrants | Albania | 67.9 /100 | #164 | Good 16.1% |
| Colombians | 65.2 /100 | #165 | Good 16.1% |