Indonesian vs Slavic Family Poverty
COMPARE
Indonesian
Slavic
Family Poverty
Family Poverty Comparison
Indonesians
Slavs
11.3%
FAMILY POVERTY
0.0/ 100
METRIC RATING
283rd/ 347
METRIC RANK
8.1%
FAMILY POVERTY
95.6/ 100
METRIC RATING
104th/ 347
METRIC RANK
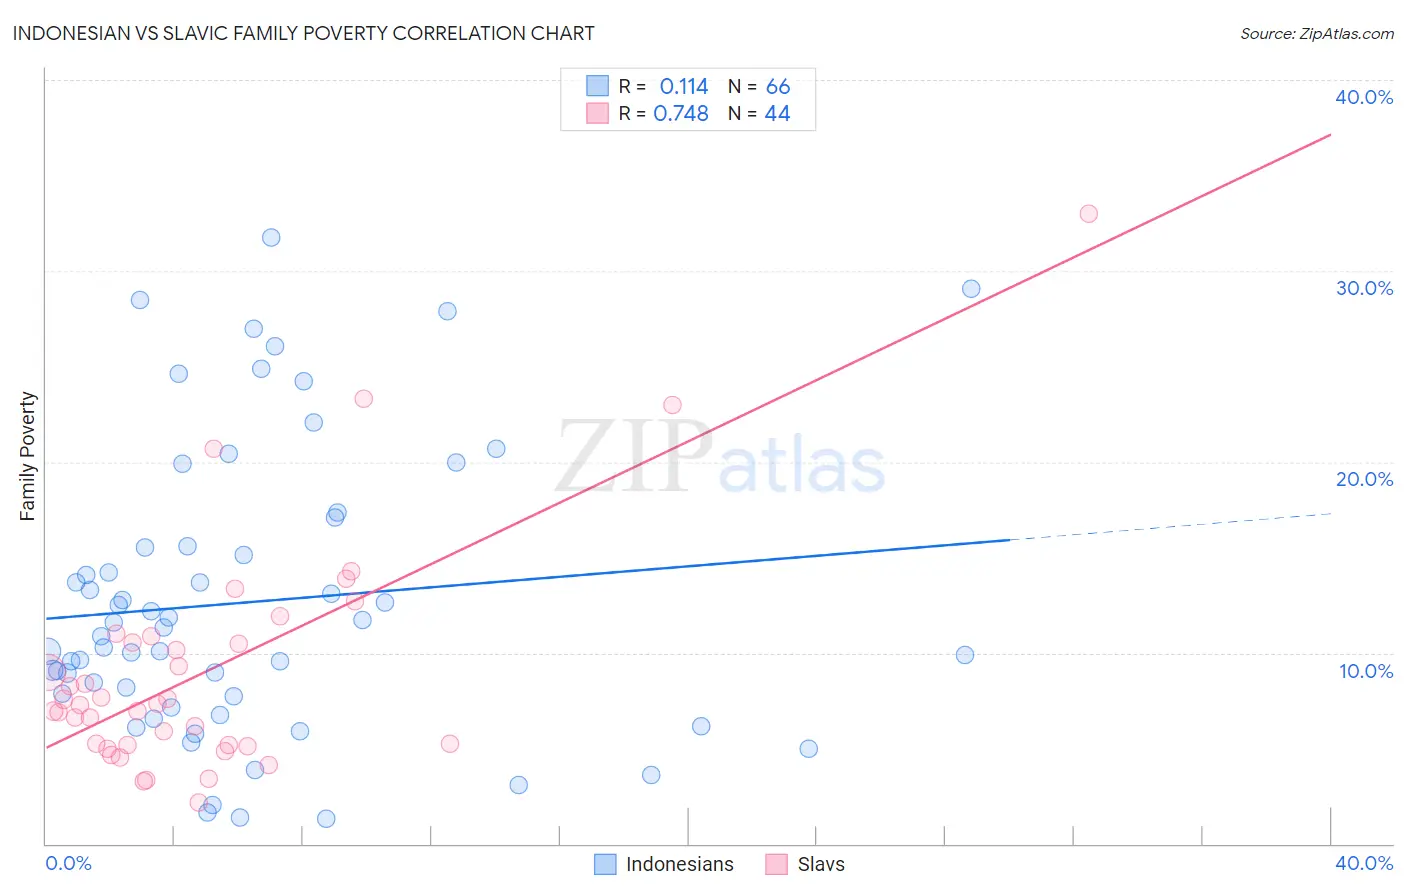
Indonesian vs Slavic Family Poverty Correlation Chart
The statistical analysis conducted on geographies consisting of 162,562,549 people shows a poor positive correlation between the proportion of Indonesians and poverty level among families in the United States with a correlation coefficient (R) of 0.114 and weighted average of 11.3%. Similarly, the statistical analysis conducted on geographies consisting of 270,374,378 people shows a strong positive correlation between the proportion of Slavs and poverty level among families in the United States with a correlation coefficient (R) of 0.748 and weighted average of 8.1%, a difference of 39.9%.
Family Poverty Correlation Summary
| Measurement | Indonesian | Slavic |
| Minimum | 1.3% | 2.2% |
| Maximum | 31.7% | 33.0% |
| Range | 30.4% | 30.8% |
| Mean | 12.7% | 9.1% |
| Median | 11.1% | 7.3% |
| Interquartile 25% (IQ1) | 7.7% | 5.2% |
| Interquartile 75% (IQ3) | 15.6% | 10.7% |
| Interquartile Range (IQR) | 7.9% | 5.5% |
| Standard Deviation (Sample) | 7.5% | 6.1% |
| Standard Deviation (Population) | 7.5% | 6.0% |
Similar Demographics by Family Poverty
Demographics Similar to Indonesians by Family Poverty
In terms of family poverty, the demographic groups most similar to Indonesians are Immigrants from Cuba (11.3%, a difference of 0.040%), Yaqui (11.3%, a difference of 0.12%), Barbadian (11.3%, a difference of 0.20%), Immigrants from West Indies (11.3%, a difference of 0.30%), and Belizean (11.3%, a difference of 0.57%).
| Demographics | Rating | Rank | Family Poverty |
| Immigrants | Guyana | 0.1 /100 | #276 | Tragic 11.2% |
| Chippewa | 0.1 /100 | #277 | Tragic 11.2% |
| Guyanese | 0.1 /100 | #278 | Tragic 11.2% |
| Blackfeet | 0.0 /100 | #279 | Tragic 11.3% |
| Belizeans | 0.0 /100 | #280 | Tragic 11.3% |
| Immigrants | West Indies | 0.0 /100 | #281 | Tragic 11.3% |
| Immigrants | Cuba | 0.0 /100 | #282 | Tragic 11.3% |
| Indonesians | 0.0 /100 | #283 | Tragic 11.3% |
| Yaqui | 0.0 /100 | #284 | Tragic 11.3% |
| Barbadians | 0.0 /100 | #285 | Tragic 11.3% |
| Senegalese | 0.0 /100 | #286 | Tragic 11.5% |
| Vietnamese | 0.0 /100 | #287 | Tragic 11.5% |
| Immigrants | Belize | 0.0 /100 | #288 | Tragic 11.5% |
| Immigrants | Barbados | 0.0 /100 | #289 | Tragic 11.5% |
| West Indians | 0.0 /100 | #290 | Tragic 11.5% |
Demographics Similar to Slavs by Family Poverty
In terms of family poverty, the demographic groups most similar to Slavs are Immigrants from Eastern Europe (8.1%, a difference of 0.010%), Laotian (8.1%, a difference of 0.030%), Immigrants from Indonesia (8.1%, a difference of 0.10%), Immigrants from Norway (8.1%, a difference of 0.11%), and New Zealander (8.1%, a difference of 0.14%).
| Demographics | Rating | Rank | Family Poverty |
| Immigrants | Switzerland | 96.1 /100 | #97 | Exceptional 8.1% |
| Immigrants | South Africa | 95.9 /100 | #98 | Exceptional 8.1% |
| Welsh | 95.8 /100 | #99 | Exceptional 8.1% |
| New Zealanders | 95.8 /100 | #100 | Exceptional 8.1% |
| Immigrants | Norway | 95.7 /100 | #101 | Exceptional 8.1% |
| Immigrants | Indonesia | 95.7 /100 | #102 | Exceptional 8.1% |
| Immigrants | Eastern Europe | 95.6 /100 | #103 | Exceptional 8.1% |
| Slavs | 95.6 /100 | #104 | Exceptional 8.1% |
| Laotians | 95.6 /100 | #105 | Exceptional 8.1% |
| Egyptians | 95.1 /100 | #106 | Exceptional 8.1% |
| French Canadians | 95.0 /100 | #107 | Exceptional 8.1% |
| Basques | 94.9 /100 | #108 | Exceptional 8.1% |
| Jordanians | 94.8 /100 | #109 | Exceptional 8.2% |
| Romanians | 94.7 /100 | #110 | Exceptional 8.2% |
| Taiwanese | 94.6 /100 | #111 | Exceptional 8.2% |