Indonesian vs Immigrants from Switzerland Male Poverty
COMPARE
Indonesian
Immigrants from Switzerland
Male Poverty
Male Poverty Comparison
Indonesians
Immigrants from Switzerland
13.8%
MALE POVERTY
0.0/ 100
METRIC RATING
292nd/ 347
METRIC RANK
10.8%
MALE POVERTY
79.2/ 100
METRIC RATING
137th/ 347
METRIC RANK
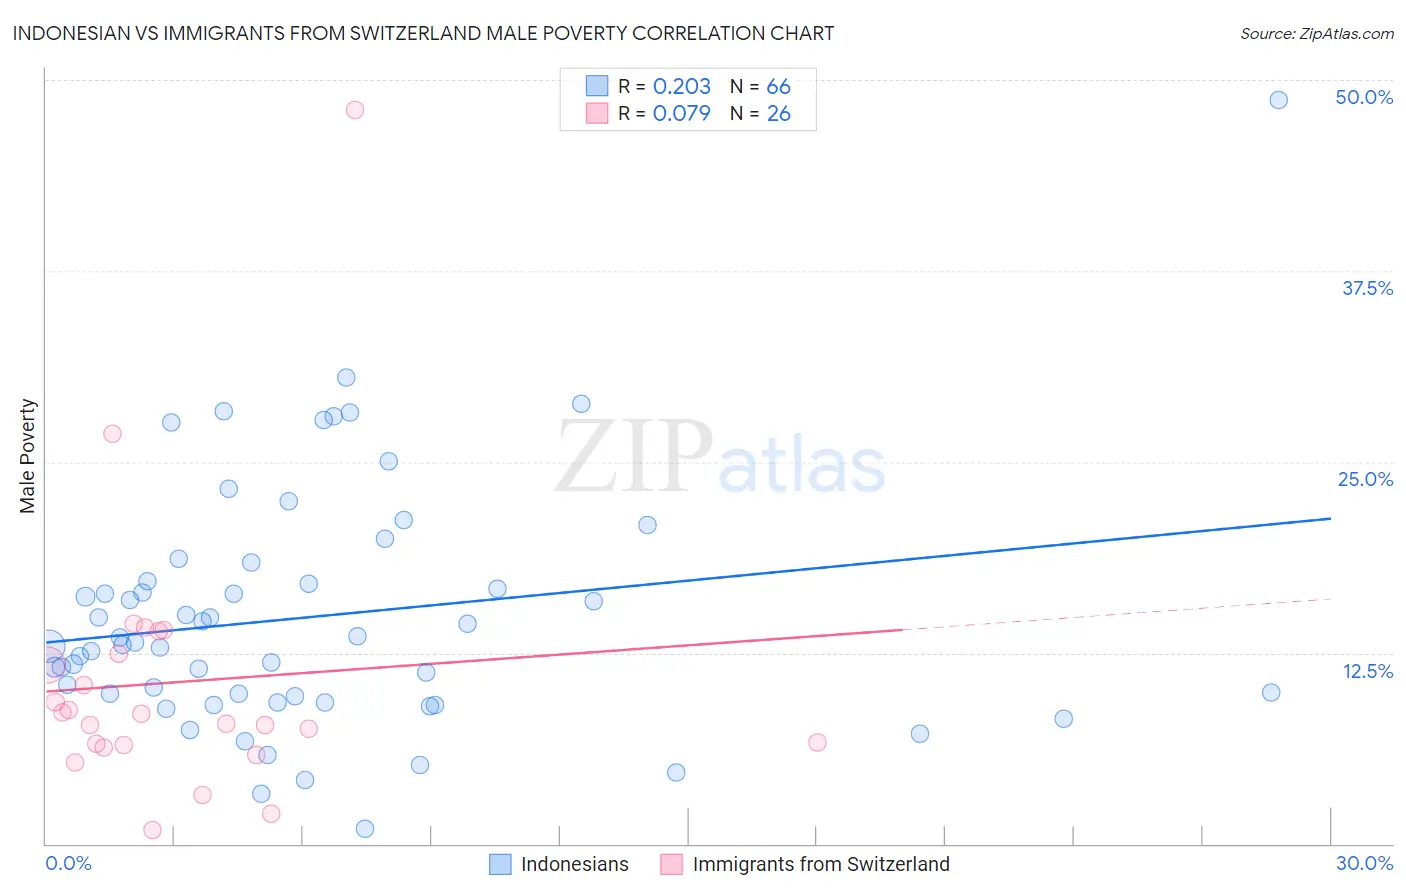
Indonesian vs Immigrants from Switzerland Male Poverty Correlation Chart
The statistical analysis conducted on geographies consisting of 162,645,449 people shows a weak positive correlation between the proportion of Indonesians and poverty level among males in the United States with a correlation coefficient (R) of 0.203 and weighted average of 13.8%. Similarly, the statistical analysis conducted on geographies consisting of 148,054,037 people shows a slight positive correlation between the proportion of Immigrants from Switzerland and poverty level among males in the United States with a correlation coefficient (R) of 0.079 and weighted average of 10.8%, a difference of 28.0%.
Male Poverty Correlation Summary
| Measurement | Indonesian | Immigrants from Switzerland |
| Minimum | 1.0% | 0.91% |
| Maximum | 48.7% | 48.0% |
| Range | 47.6% | 47.1% |
| Mean | 14.9% | 10.6% |
| Median | 13.1% | 8.2% |
| Interquartile 25% (IQ1) | 9.6% | 6.5% |
| Interquartile 75% (IQ3) | 17.2% | 12.5% |
| Interquartile Range (IQR) | 7.5% | 6.0% |
| Standard Deviation (Sample) | 8.0% | 9.2% |
| Standard Deviation (Population) | 8.0% | 9.0% |
Similar Demographics by Male Poverty
Demographics Similar to Indonesians by Male Poverty
In terms of male poverty, the demographic groups most similar to Indonesians are Immigrants from Belize (13.8%, a difference of 0.010%), Hispanic or Latino (13.9%, a difference of 0.070%), Vietnamese (13.8%, a difference of 0.17%), Guatemalan (13.8%, a difference of 0.26%), and Immigrants from Zaire (13.8%, a difference of 0.26%).
| Demographics | Rating | Rank | Male Poverty |
| West Indians | 0.0 /100 | #285 | Tragic 13.8% |
| Shoshone | 0.0 /100 | #286 | Tragic 13.8% |
| Immigrants | Barbados | 0.0 /100 | #287 | Tragic 13.8% |
| Immigrants | St. Vincent and the Grenadines | 0.0 /100 | #288 | Tragic 13.8% |
| Guatemalans | 0.0 /100 | #289 | Tragic 13.8% |
| Immigrants | Zaire | 0.0 /100 | #290 | Tragic 13.8% |
| Vietnamese | 0.0 /100 | #291 | Tragic 13.8% |
| Indonesians | 0.0 /100 | #292 | Tragic 13.8% |
| Immigrants | Belize | 0.0 /100 | #293 | Tragic 13.8% |
| Hispanics or Latinos | 0.0 /100 | #294 | Tragic 13.9% |
| Immigrants | Central America | 0.0 /100 | #295 | Tragic 13.9% |
| Cajuns | 0.0 /100 | #296 | Tragic 13.9% |
| Inupiat | 0.0 /100 | #297 | Tragic 14.0% |
| Blackfeet | 0.0 /100 | #298 | Tragic 14.0% |
| Immigrants | Guatemala | 0.0 /100 | #299 | Tragic 14.0% |
Demographics Similar to Immigrants from Switzerland by Male Poverty
In terms of male poverty, the demographic groups most similar to Immigrants from Switzerland are Yugoslavian (10.8%, a difference of 0.15%), Immigrants from Israel (10.8%, a difference of 0.26%), Immigrants from Jordan (10.8%, a difference of 0.27%), Tlingit-Haida (10.9%, a difference of 0.46%), and Immigrants from France (10.9%, a difference of 0.49%).
| Demographics | Rating | Rank | Male Poverty |
| Chileans | 83.9 /100 | #130 | Excellent 10.7% |
| Immigrants | Belarus | 83.3 /100 | #131 | Excellent 10.7% |
| Immigrants | Vietnam | 83.0 /100 | #132 | Excellent 10.8% |
| Pakistanis | 83.0 /100 | #133 | Excellent 10.8% |
| New Zealanders | 82.9 /100 | #134 | Excellent 10.8% |
| Brazilians | 82.7 /100 | #135 | Excellent 10.8% |
| Immigrants | Israel | 80.9 /100 | #136 | Excellent 10.8% |
| Immigrants | Switzerland | 79.2 /100 | #137 | Good 10.8% |
| Yugoslavians | 78.2 /100 | #138 | Good 10.8% |
| Immigrants | Jordan | 77.5 /100 | #139 | Good 10.8% |
| Tlingit-Haida | 76.1 /100 | #140 | Good 10.9% |
| Immigrants | France | 75.8 /100 | #141 | Good 10.9% |
| Basques | 74.6 /100 | #142 | Good 10.9% |
| Afghans | 71.9 /100 | #143 | Good 10.9% |
| Samoans | 71.8 /100 | #144 | Good 10.9% |