Indian (Asian) vs Immigrants from Sri Lanka Child Poverty Under the Age of 5
COMPARE
Indian (Asian)
Immigrants from Sri Lanka
Child Poverty Under the Age of 5
Child Poverty Under the Age of 5 Comparison
Indians (Asian)
Immigrants from Sri Lanka
13.4%
CHILD POVERTY UNDER THE AGE OF 5
100.0/ 100
METRIC RATING
15th/ 347
METRIC RANK
14.4%
CHILD POVERTY UNDER THE AGE OF 5
99.8/ 100
METRIC RATING
32nd/ 347
METRIC RANK
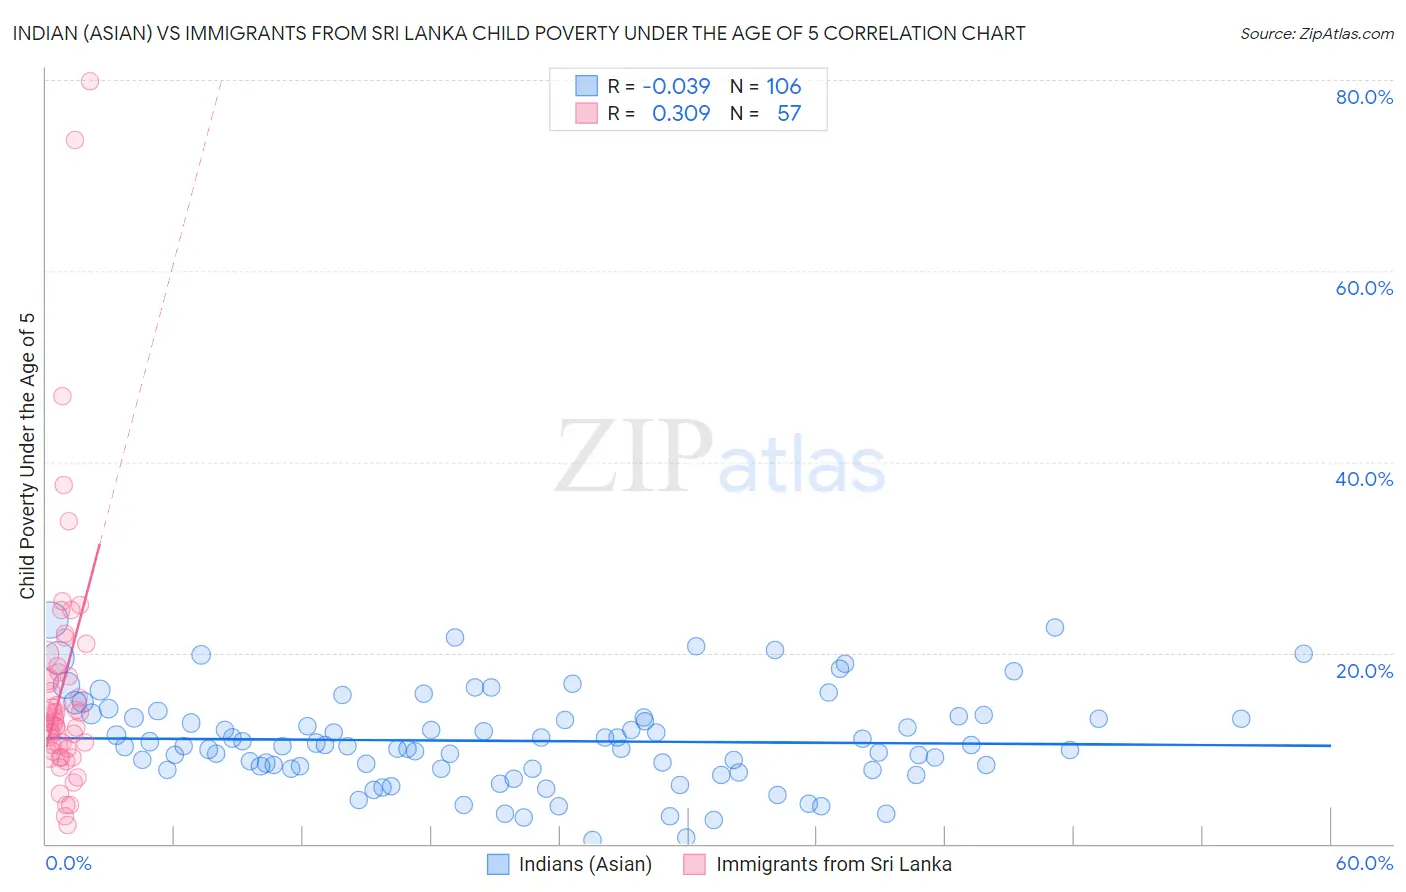
Indian (Asian) vs Immigrants from Sri Lanka Child Poverty Under the Age of 5 Correlation Chart
The statistical analysis conducted on geographies consisting of 467,922,694 people shows no correlation between the proportion of Indians (Asian) and poverty level among children under the age of 5 in the United States with a correlation coefficient (R) of -0.039 and weighted average of 13.4%. Similarly, the statistical analysis conducted on geographies consisting of 146,204,639 people shows a mild positive correlation between the proportion of Immigrants from Sri Lanka and poverty level among children under the age of 5 in the United States with a correlation coefficient (R) of 0.309 and weighted average of 14.4%, a difference of 7.4%.
Child Poverty Under the Age of 5 Correlation Summary
| Measurement | Indian (Asian) | Immigrants from Sri Lanka |
| Minimum | 0.39% | 1.9% |
| Maximum | 23.5% | 79.8% |
| Range | 23.1% | 77.9% |
| Mean | 10.8% | 16.7% |
| Median | 10.3% | 12.8% |
| Interquartile 25% (IQ1) | 7.8% | 9.8% |
| Interquartile 75% (IQ3) | 13.2% | 18.3% |
| Interquartile Range (IQR) | 5.3% | 8.5% |
| Standard Deviation (Sample) | 4.8% | 14.1% |
| Standard Deviation (Population) | 4.8% | 14.0% |
Demographics Similar to Indians (Asian) and Immigrants from Sri Lanka by Child Poverty Under the Age of 5
In terms of child poverty under the age of 5, the demographic groups most similar to Indians (Asian) are Okinawan (13.4%, a difference of 0.050%), Immigrants from Eastern Asia (13.5%, a difference of 0.51%), Bhutanese (13.4%, a difference of 0.70%), Assyrian/Chaldean/Syriac (13.6%, a difference of 0.86%), and Immigrants from China (13.6%, a difference of 1.1%). Similarly, the demographic groups most similar to Immigrants from Sri Lanka are Korean (14.4%, a difference of 0.28%), Taiwanese (14.5%, a difference of 0.30%), Cambodian (14.4%, a difference of 0.31%), Immigrants from Asia (14.4%, a difference of 0.36%), and Immigrants from Indonesia (14.3%, a difference of 0.75%).
| Demographics | Rating | Rank | Child Poverty Under the Age of 5 |
| Bhutanese | 100.0 /100 | #13 | Exceptional 13.4% |
| Okinawans | 100.0 /100 | #14 | Exceptional 13.4% |
| Indians (Asian) | 100.0 /100 | #15 | Exceptional 13.4% |
| Immigrants | Eastern Asia | 100.0 /100 | #16 | Exceptional 13.5% |
| Assyrians/Chaldeans/Syriacs | 100.0 /100 | #17 | Exceptional 13.6% |
| Immigrants | China | 100.0 /100 | #18 | Exceptional 13.6% |
| Immigrants | Ireland | 100.0 /100 | #19 | Exceptional 13.7% |
| Immigrants | Japan | 100.0 /100 | #20 | Exceptional 13.8% |
| Bolivians | 100.0 /100 | #21 | Exceptional 13.8% |
| Immigrants | Bolivia | 100.0 /100 | #22 | Exceptional 13.8% |
| Bulgarians | 99.9 /100 | #23 | Exceptional 13.9% |
| Asians | 99.9 /100 | #24 | Exceptional 14.0% |
| Cypriots | 99.9 /100 | #25 | Exceptional 14.0% |
| Immigrants | Lithuania | 99.9 /100 | #26 | Exceptional 14.1% |
| Tongans | 99.9 /100 | #27 | Exceptional 14.2% |
| Immigrants | Indonesia | 99.8 /100 | #28 | Exceptional 14.3% |
| Immigrants | Asia | 99.8 /100 | #29 | Exceptional 14.4% |
| Cambodians | 99.8 /100 | #30 | Exceptional 14.4% |
| Koreans | 99.8 /100 | #31 | Exceptional 14.4% |
| Immigrants | Sri Lanka | 99.8 /100 | #32 | Exceptional 14.4% |
| Taiwanese | 99.8 /100 | #33 | Exceptional 14.5% |