Indian (Asian) vs Immigrants from Afghanistan Female Poverty
COMPARE
Indian (Asian)
Immigrants from Afghanistan
Female Poverty
Female Poverty Comparison
Indians (Asian)
Immigrants from Afghanistan
12.2%
FEMALE POVERTY
97.9/ 100
METRIC RATING
65th/ 347
METRIC RANK
13.4%
FEMALE POVERTY
50.8/ 100
METRIC RATING
173rd/ 347
METRIC RANK
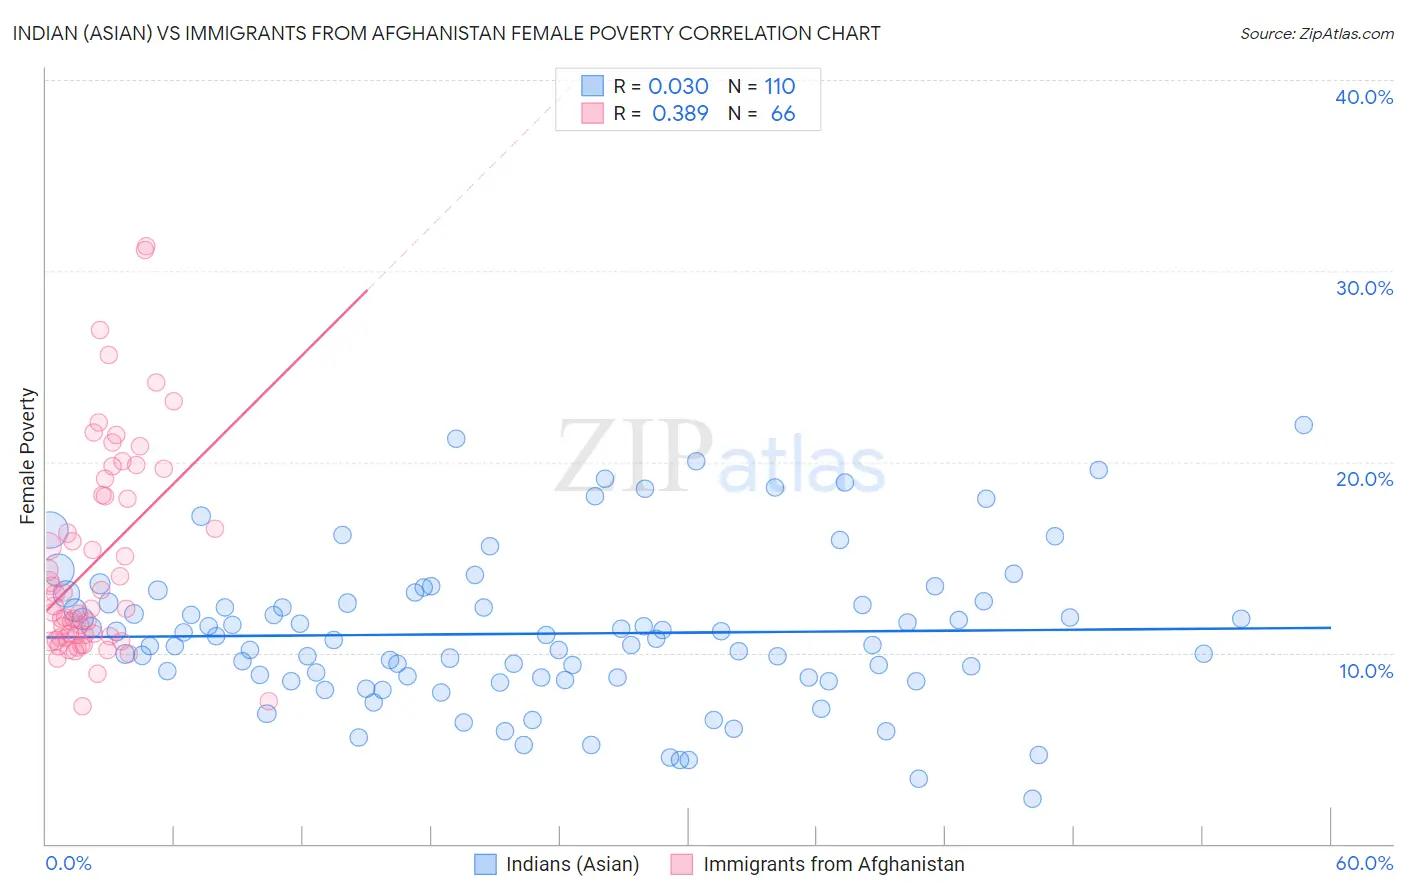
Indian (Asian) vs Immigrants from Afghanistan Female Poverty Correlation Chart
The statistical analysis conducted on geographies consisting of 494,574,283 people shows no correlation between the proportion of Indians (Asian) and poverty level among females in the United States with a correlation coefficient (R) of 0.030 and weighted average of 12.2%. Similarly, the statistical analysis conducted on geographies consisting of 147,630,543 people shows a mild positive correlation between the proportion of Immigrants from Afghanistan and poverty level among females in the United States with a correlation coefficient (R) of 0.389 and weighted average of 13.4%, a difference of 10.2%.
Female Poverty Correlation Summary
| Measurement | Indian (Asian) | Immigrants from Afghanistan |
| Minimum | 2.4% | 7.2% |
| Maximum | 21.9% | 31.3% |
| Range | 19.5% | 24.1% |
| Mean | 11.0% | 14.8% |
| Median | 10.7% | 12.4% |
| Interquartile 25% (IQ1) | 8.7% | 10.8% |
| Interquartile 75% (IQ3) | 12.6% | 18.2% |
| Interquartile Range (IQR) | 3.9% | 7.4% |
| Standard Deviation (Sample) | 3.9% | 5.5% |
| Standard Deviation (Population) | 3.9% | 5.4% |
Similar Demographics by Female Poverty
Demographics Similar to Indians (Asian) by Female Poverty
In terms of female poverty, the demographic groups most similar to Indians (Asian) are Austrian (12.2%, a difference of 0.010%), German (12.2%, a difference of 0.030%), Ukrainian (12.2%, a difference of 0.060%), Immigrants from Italy (12.2%, a difference of 0.14%), and Immigrants from Eastern Asia (12.2%, a difference of 0.14%).
| Demographics | Rating | Rank | Female Poverty |
| Scandinavians | 98.2 /100 | #58 | Exceptional 12.1% |
| Immigrants | Europe | 98.2 /100 | #59 | Exceptional 12.1% |
| Immigrants | Australia | 98.1 /100 | #60 | Exceptional 12.2% |
| Immigrants | Asia | 98.1 /100 | #61 | Exceptional 12.2% |
| Immigrants | Italy | 98.0 /100 | #62 | Exceptional 12.2% |
| Ukrainians | 98.0 /100 | #63 | Exceptional 12.2% |
| Germans | 98.0 /100 | #64 | Exceptional 12.2% |
| Indians (Asian) | 97.9 /100 | #65 | Exceptional 12.2% |
| Austrians | 97.9 /100 | #66 | Exceptional 12.2% |
| Immigrants | Eastern Asia | 97.8 /100 | #67 | Exceptional 12.2% |
| Immigrants | Netherlands | 97.8 /100 | #68 | Exceptional 12.2% |
| Swiss | 97.7 /100 | #69 | Exceptional 12.2% |
| Immigrants | Belgium | 97.7 /100 | #70 | Exceptional 12.2% |
| Carpatho Rusyns | 97.6 /100 | #71 | Exceptional 12.2% |
| Cambodians | 97.5 /100 | #72 | Exceptional 12.2% |
Demographics Similar to Immigrants from Afghanistan by Female Poverty
In terms of female poverty, the demographic groups most similar to Immigrants from Afghanistan are Immigrants from Iraq (13.4%, a difference of 0.070%), Celtic (13.4%, a difference of 0.080%), Immigrants from Spain (13.4%, a difference of 0.090%), Immigrants from Morocco (13.4%, a difference of 0.13%), and Israeli (13.5%, a difference of 0.16%).
| Demographics | Rating | Rank | Female Poverty |
| Immigrants | Oceania | 59.7 /100 | #166 | Average 13.3% |
| Immigrants | Chile | 57.4 /100 | #167 | Average 13.3% |
| Aleuts | 56.7 /100 | #168 | Average 13.4% |
| Lebanese | 55.9 /100 | #169 | Average 13.4% |
| Colombians | 55.7 /100 | #170 | Average 13.4% |
| Whites/Caucasians | 54.6 /100 | #171 | Average 13.4% |
| Mongolians | 53.6 /100 | #172 | Average 13.4% |
| Immigrants | Afghanistan | 50.8 /100 | #173 | Average 13.4% |
| Immigrants | Iraq | 50.0 /100 | #174 | Average 13.4% |
| Celtics | 49.9 /100 | #175 | Average 13.4% |
| Immigrants | Spain | 49.9 /100 | #176 | Average 13.4% |
| Immigrants | Morocco | 49.4 /100 | #177 | Average 13.4% |
| Israelis | 49.1 /100 | #178 | Average 13.5% |
| Immigrants | Syria | 48.8 /100 | #179 | Average 13.5% |
| South Americans | 44.8 /100 | #180 | Average 13.5% |