Indian (Asian) vs Cree Family Poverty
COMPARE
Indian (Asian)
Cree
Family Poverty
Family Poverty Comparison
Indians (Asian)
Cree
7.7%
FAMILY POVERTY
98.8/ 100
METRIC RATING
52nd/ 347
METRIC RANK
10.5%
FAMILY POVERTY
0.7/ 100
METRIC RATING
244th/ 347
METRIC RANK
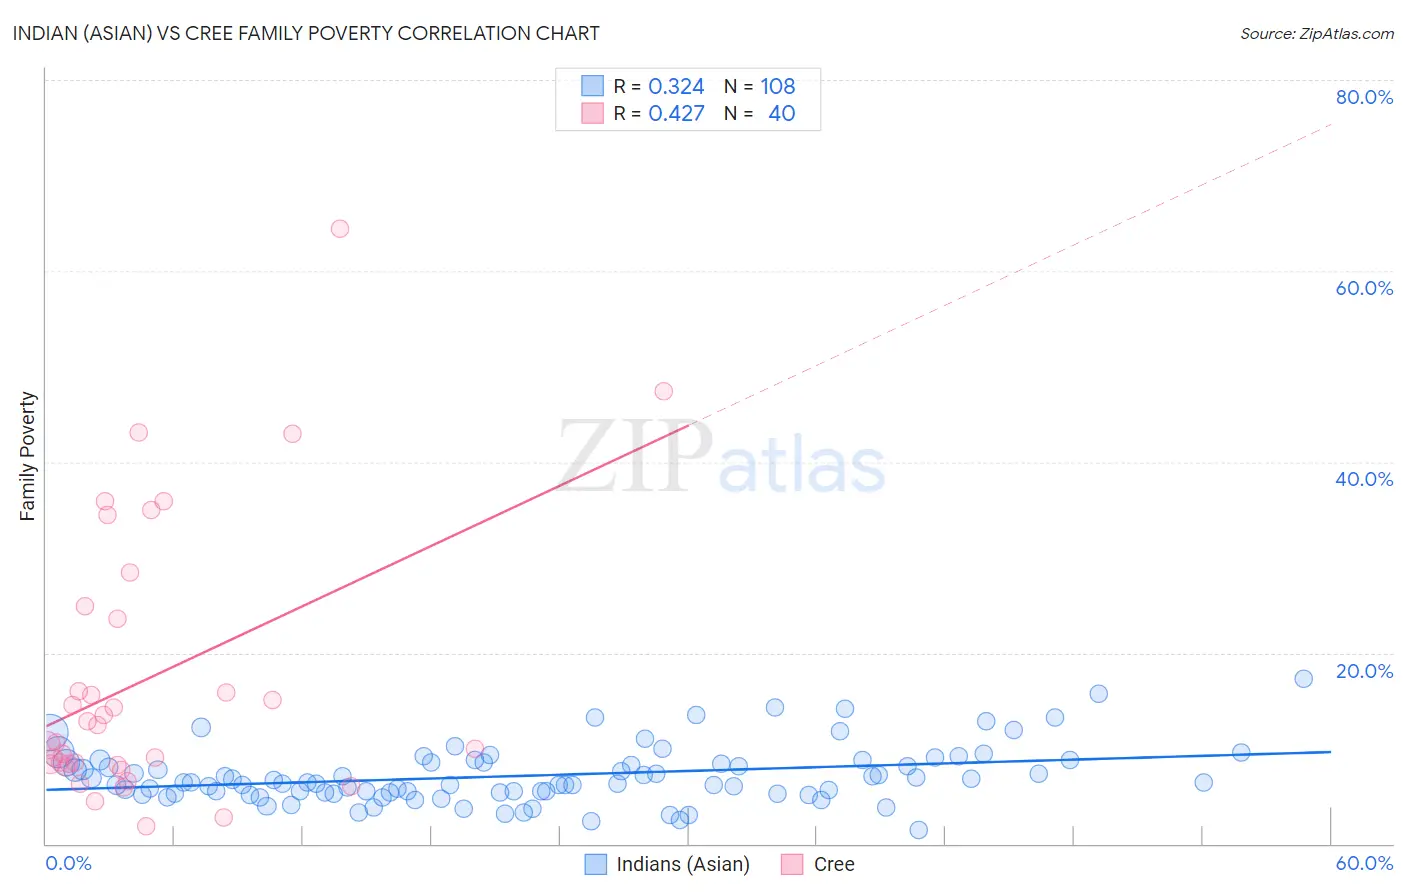
Indian (Asian) vs Cree Family Poverty Correlation Chart
The statistical analysis conducted on geographies consisting of 492,769,708 people shows a mild positive correlation between the proportion of Indians (Asian) and poverty level among families in the United States with a correlation coefficient (R) of 0.324 and weighted average of 7.7%. Similarly, the statistical analysis conducted on geographies consisting of 76,172,191 people shows a moderate positive correlation between the proportion of Cree and poverty level among families in the United States with a correlation coefficient (R) of 0.427 and weighted average of 10.5%, a difference of 35.7%.
Family Poverty Correlation Summary
| Measurement | Indian (Asian) | Cree |
| Minimum | 1.5% | 1.8% |
| Maximum | 17.3% | 64.4% |
| Range | 15.8% | 62.6% |
| Mean | 7.1% | 17.4% |
| Median | 6.4% | 11.6% |
| Interquartile 25% (IQ1) | 5.4% | 8.3% |
| Interquartile 75% (IQ3) | 8.6% | 24.2% |
| Interquartile Range (IQR) | 3.2% | 16.0% |
| Standard Deviation (Sample) | 3.0% | 14.4% |
| Standard Deviation (Population) | 2.9% | 14.2% |
Similar Demographics by Family Poverty
Demographics Similar to Indians (Asian) by Family Poverty
In terms of family poverty, the demographic groups most similar to Indians (Asian) are Swiss (7.7%, a difference of 0.060%), Immigrants from Sweden (7.7%, a difference of 0.070%), Immigrants from Eastern Asia (7.7%, a difference of 0.10%), Immigrants from Serbia (7.7%, a difference of 0.14%), and Immigrants from Moldova (7.7%, a difference of 0.16%).
| Demographics | Rating | Rank | Family Poverty |
| Okinawans | 98.9 /100 | #45 | Exceptional 7.7% |
| Tongans | 98.9 /100 | #46 | Exceptional 7.7% |
| Immigrants | Czechoslovakia | 98.9 /100 | #47 | Exceptional 7.7% |
| Immigrants | Sri Lanka | 98.9 /100 | #48 | Exceptional 7.7% |
| Immigrants | Bolivia | 98.9 /100 | #49 | Exceptional 7.7% |
| Immigrants | North Macedonia | 98.9 /100 | #50 | Exceptional 7.7% |
| Immigrants | Moldova | 98.8 /100 | #51 | Exceptional 7.7% |
| Indians (Asian) | 98.8 /100 | #52 | Exceptional 7.7% |
| Swiss | 98.8 /100 | #53 | Exceptional 7.7% |
| Immigrants | Sweden | 98.8 /100 | #54 | Exceptional 7.7% |
| Immigrants | Eastern Asia | 98.7 /100 | #55 | Exceptional 7.7% |
| Immigrants | Serbia | 98.7 /100 | #56 | Exceptional 7.7% |
| Asians | 98.7 /100 | #57 | Exceptional 7.7% |
| Finns | 98.7 /100 | #58 | Exceptional 7.7% |
| Europeans | 98.7 /100 | #59 | Exceptional 7.7% |
Demographics Similar to Cree by Family Poverty
In terms of family poverty, the demographic groups most similar to Cree are Nepalese (10.4%, a difference of 0.46%), Immigrants from Burma/Myanmar (10.5%, a difference of 0.61%), Alaska Native (10.4%, a difference of 0.94%), Cherokee (10.6%, a difference of 1.3%), and Liberian (10.6%, a difference of 1.3%).
| Demographics | Rating | Rank | Family Poverty |
| Immigrants | Laos | 1.7 /100 | #237 | Tragic 10.2% |
| French American Indians | 1.5 /100 | #238 | Tragic 10.2% |
| Potawatomi | 1.5 /100 | #239 | Tragic 10.2% |
| Immigrants | Azores | 1.4 /100 | #240 | Tragic 10.3% |
| Ghanaians | 1.3 /100 | #241 | Tragic 10.3% |
| Alaska Natives | 1.0 /100 | #242 | Tragic 10.4% |
| Nepalese | 0.8 /100 | #243 | Tragic 10.4% |
| Cree | 0.7 /100 | #244 | Tragic 10.5% |
| Immigrants | Burma/Myanmar | 0.6 /100 | #245 | Tragic 10.5% |
| Cherokee | 0.5 /100 | #246 | Tragic 10.6% |
| Liberians | 0.4 /100 | #247 | Tragic 10.6% |
| Nicaraguans | 0.4 /100 | #248 | Tragic 10.6% |
| Cubans | 0.4 /100 | #249 | Tragic 10.6% |
| Salvadorans | 0.3 /100 | #250 | Tragic 10.7% |
| Iroquois | 0.3 /100 | #251 | Tragic 10.7% |