Immigrants vs Immigrants from Russia Seniors Poverty Over the Age of 75
COMPARE
Immigrants
Immigrants from Russia
Seniors Poverty Over the Age of 75
Seniors Poverty Over the Age of 75 Comparison
Immigrants
Immigrants from Russia
13.9%
SENIORS POVERTY OVER THE AGE OF 75
0.1/ 100
METRIC RATING
260th/ 347
METRIC RANK
13.4%
SENIORS POVERTY OVER THE AGE OF 75
0.6/ 100
METRIC RATING
241st/ 347
METRIC RANK
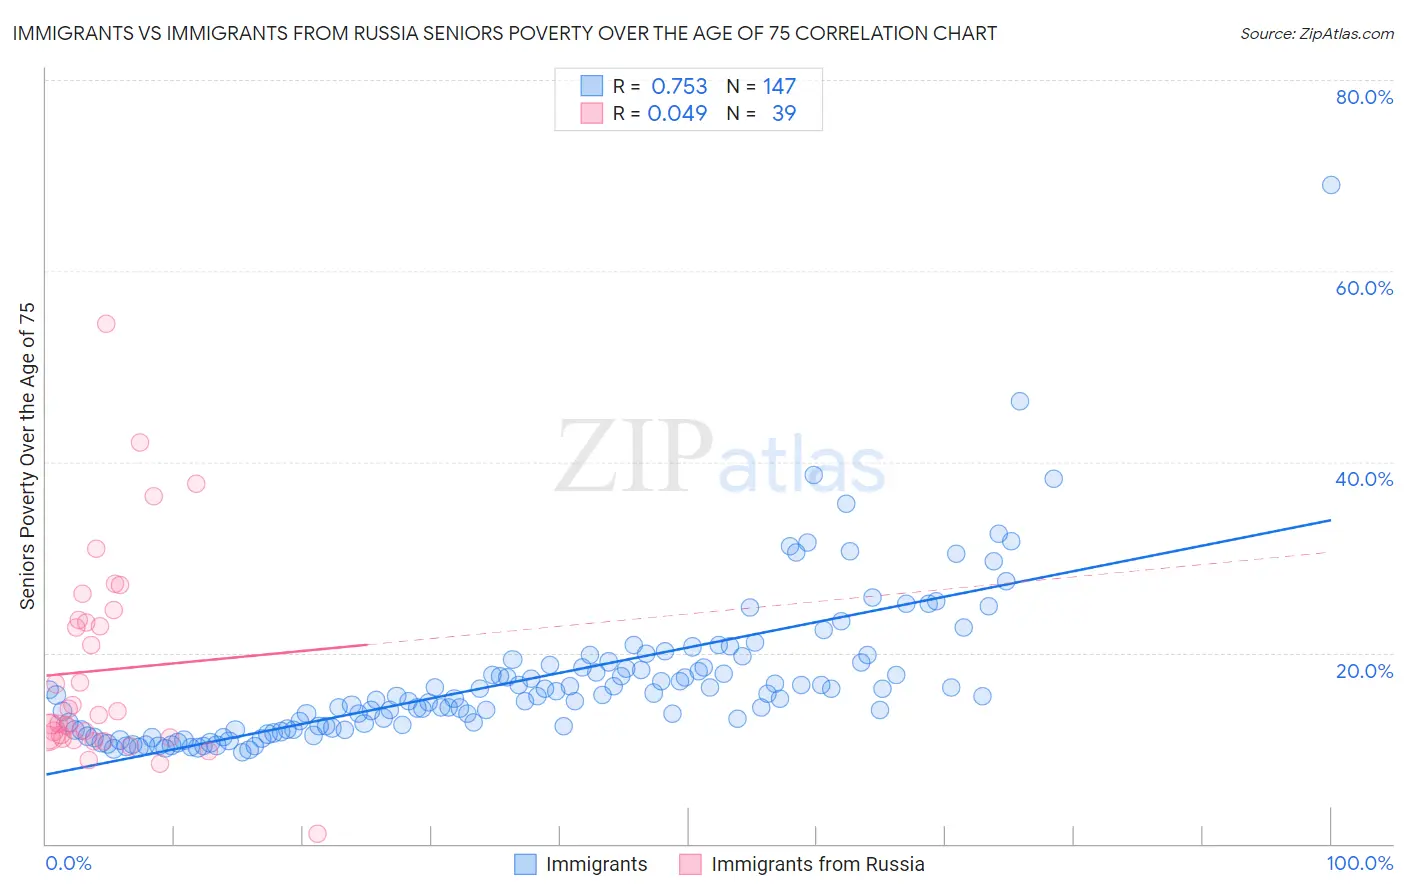
Immigrants vs Immigrants from Russia Seniors Poverty Over the Age of 75 Correlation Chart
The statistical analysis conducted on geographies consisting of 559,996,265 people shows a strong positive correlation between the proportion of Immigrants and poverty level among seniors over the age of 75 in the United States with a correlation coefficient (R) of 0.753 and weighted average of 13.9%. Similarly, the statistical analysis conducted on geographies consisting of 344,073,236 people shows no correlation between the proportion of Immigrants from Russia and poverty level among seniors over the age of 75 in the United States with a correlation coefficient (R) of 0.049 and weighted average of 13.4%, a difference of 3.7%.
Seniors Poverty Over the Age of 75 Correlation Summary
| Measurement | Immigrants | Immigrants from Russia |
| Minimum | 9.5% | 1.1% |
| Maximum | 69.0% | 54.4% |
| Range | 59.4% | 53.3% |
| Mean | 17.2% | 18.2% |
| Median | 15.5% | 13.4% |
| Interquartile 25% (IQ1) | 12.0% | 11.1% |
| Interquartile 75% (IQ3) | 18.7% | 23.4% |
| Interquartile Range (IQR) | 6.7% | 12.4% |
| Standard Deviation (Sample) | 7.8% | 10.8% |
| Standard Deviation (Population) | 7.8% | 10.7% |
Demographics Similar to Immigrants and Immigrants from Russia by Seniors Poverty Over the Age of 75
In terms of seniors poverty over the age of 75, the demographic groups most similar to Immigrants are Immigrants from Portugal (13.9%, a difference of 0.070%), Immigrants from Panama (13.9%, a difference of 0.10%), Immigrants from Western Africa (13.9%, a difference of 0.20%), Inupiat (13.8%, a difference of 0.78%), and Immigrants from Belarus (13.8%, a difference of 1.3%). Similarly, the demographic groups most similar to Immigrants from Russia are Immigrants from Somalia (13.5%, a difference of 0.10%), Dutch West Indian (13.5%, a difference of 0.12%), Argentinean (13.4%, a difference of 0.14%), Spanish American (13.5%, a difference of 0.44%), and Uruguayan (13.5%, a difference of 0.58%).
| Demographics | Rating | Rank | Seniors Poverty Over the Age of 75 |
| Argentineans | 0.7 /100 | #240 | Tragic 13.4% |
| Immigrants | Russia | 0.6 /100 | #241 | Tragic 13.4% |
| Immigrants | Somalia | 0.6 /100 | #242 | Tragic 13.5% |
| Dutch West Indians | 0.6 /100 | #243 | Tragic 13.5% |
| Spanish Americans | 0.5 /100 | #244 | Tragic 13.5% |
| Uruguayans | 0.5 /100 | #245 | Tragic 13.5% |
| Immigrants | Cambodia | 0.4 /100 | #246 | Tragic 13.6% |
| Immigrants | Ukraine | 0.3 /100 | #247 | Tragic 13.6% |
| Africans | 0.3 /100 | #248 | Tragic 13.6% |
| Immigrants | Albania | 0.3 /100 | #249 | Tragic 13.6% |
| Mexican American Indians | 0.3 /100 | #250 | Tragic 13.6% |
| Immigrants | Peru | 0.3 /100 | #251 | Tragic 13.7% |
| Immigrants | Argentina | 0.3 /100 | #252 | Tragic 13.7% |
| Immigrants | Spain | 0.2 /100 | #253 | Tragic 13.7% |
| Blackfeet | 0.2 /100 | #254 | Tragic 13.7% |
| Immigrants | Belarus | 0.2 /100 | #255 | Tragic 13.8% |
| Inupiat | 0.1 /100 | #256 | Tragic 13.8% |
| Immigrants | Western Africa | 0.1 /100 | #257 | Tragic 13.9% |
| Immigrants | Panama | 0.1 /100 | #258 | Tragic 13.9% |
| Immigrants | Portugal | 0.1 /100 | #259 | Tragic 13.9% |
| Immigrants | Immigrants | 0.1 /100 | #260 | Tragic 13.9% |