Immigrants vs Aleut Single Father Poverty
COMPARE
Immigrants
Aleut
Single Father Poverty
Single Father Poverty Comparison
Immigrants
Aleuts
15.9%
SINGLE FATHER POVERTY
91.9/ 100
METRIC RATING
121st/ 347
METRIC RANK
16.4%
SINGLE FATHER POVERTY
35.3/ 100
METRIC RATING
183rd/ 347
METRIC RANK
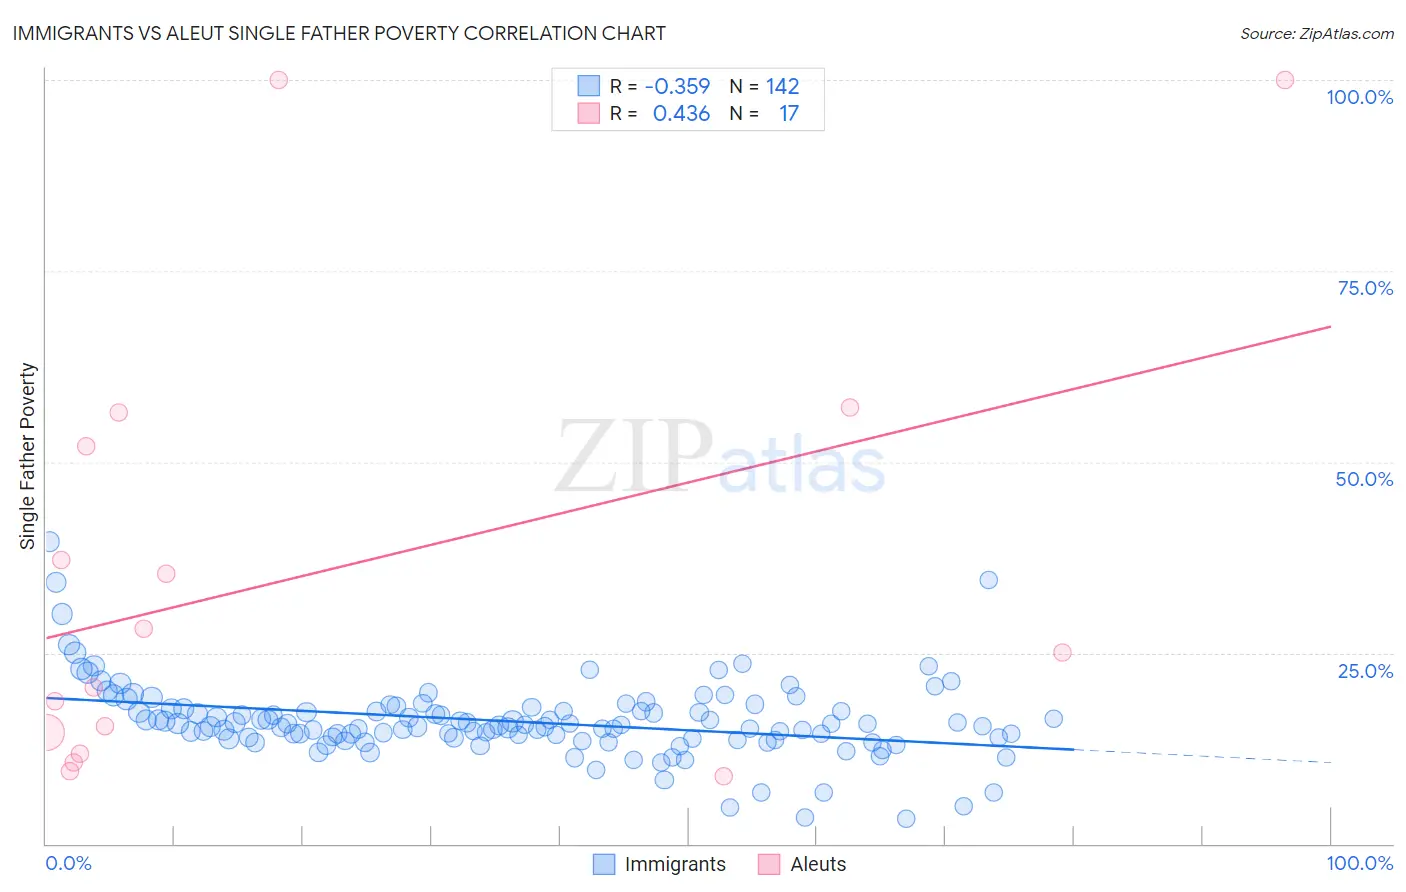
Immigrants vs Aleut Single Father Poverty Correlation Chart
The statistical analysis conducted on geographies consisting of 413,041,204 people shows a mild negative correlation between the proportion of Immigrants and poverty level among single fathers in the United States with a correlation coefficient (R) of -0.359 and weighted average of 15.9%. Similarly, the statistical analysis conducted on geographies consisting of 56,707,511 people shows a moderate positive correlation between the proportion of Aleuts and poverty level among single fathers in the United States with a correlation coefficient (R) of 0.436 and weighted average of 16.4%, a difference of 3.5%.
Single Father Poverty Correlation Summary
| Measurement | Immigrants | Aleut |
| Minimum | 3.3% | 8.8% |
| Maximum | 39.5% | 100.0% |
| Range | 36.3% | 91.2% |
| Mean | 16.0% | 35.4% |
| Median | 15.5% | 25.0% |
| Interquartile 25% (IQ1) | 13.9% | 13.1% |
| Interquartile 75% (IQ3) | 17.6% | 54.3% |
| Interquartile Range (IQR) | 3.8% | 41.1% |
| Standard Deviation (Sample) | 5.0% | 29.1% |
| Standard Deviation (Population) | 5.0% | 28.3% |
Similar Demographics by Single Father Poverty
Demographics Similar to Immigrants by Single Father Poverty
In terms of single father poverty, the demographic groups most similar to Immigrants are Uruguayan (15.9%, a difference of 0.020%), Sudanese (15.9%, a difference of 0.060%), Immigrants from Belarus (15.8%, a difference of 0.080%), Immigrants from Eastern Europe (15.8%, a difference of 0.090%), and Palestinian (15.9%, a difference of 0.10%).
| Demographics | Rating | Rank | Single Father Poverty |
| Argentineans | 94.4 /100 | #114 | Exceptional 15.8% |
| Immigrants | Thailand | 93.6 /100 | #115 | Exceptional 15.8% |
| Immigrants | Argentina | 92.8 /100 | #116 | Exceptional 15.8% |
| Immigrants | Colombia | 92.6 /100 | #117 | Exceptional 15.8% |
| Immigrants | Eastern Europe | 92.5 /100 | #118 | Exceptional 15.8% |
| Immigrants | Belarus | 92.4 /100 | #119 | Exceptional 15.8% |
| Uruguayans | 92.1 /100 | #120 | Exceptional 15.9% |
| Immigrants | Immigrants | 91.9 /100 | #121 | Exceptional 15.9% |
| Sudanese | 91.6 /100 | #122 | Exceptional 15.9% |
| Palestinians | 91.3 /100 | #123 | Exceptional 15.9% |
| Immigrants | Panama | 91.3 /100 | #124 | Exceptional 15.9% |
| Iraqis | 91.2 /100 | #125 | Exceptional 15.9% |
| Hmong | 91.1 /100 | #126 | Exceptional 15.9% |
| Immigrants | Liberia | 91.1 /100 | #127 | Exceptional 15.9% |
| Immigrants | Nigeria | 90.8 /100 | #128 | Exceptional 15.9% |
Demographics Similar to Aleuts by Single Father Poverty
In terms of single father poverty, the demographic groups most similar to Aleuts are Immigrants from Italy (16.4%, a difference of 0.020%), Immigrants from Western Africa (16.4%, a difference of 0.030%), Cambodian (16.4%, a difference of 0.030%), Panamanian (16.4%, a difference of 0.080%), and Immigrants from Latin America (16.4%, a difference of 0.090%).
| Demographics | Rating | Rank | Single Father Poverty |
| Vietnamese | 48.0 /100 | #176 | Average 16.3% |
| Immigrants | South Africa | 44.2 /100 | #177 | Average 16.3% |
| Immigrants | Cuba | 41.6 /100 | #178 | Average 16.4% |
| Serbians | 40.9 /100 | #179 | Average 16.4% |
| Immigrants | Latin America | 37.2 /100 | #180 | Fair 16.4% |
| Immigrants | Western Africa | 36.0 /100 | #181 | Fair 16.4% |
| Immigrants | Italy | 35.7 /100 | #182 | Fair 16.4% |
| Aleuts | 35.3 /100 | #183 | Fair 16.4% |
| Cambodians | 34.6 /100 | #184 | Fair 16.4% |
| Panamanians | 33.6 /100 | #185 | Fair 16.4% |
| Immigrants | Venezuela | 31.0 /100 | #186 | Fair 16.4% |
| Ukrainians | 30.4 /100 | #187 | Fair 16.4% |
| Russians | 30.1 /100 | #188 | Fair 16.4% |
| Latvians | 28.9 /100 | #189 | Fair 16.5% |
| Immigrants | Burma/Myanmar | 28.0 /100 | #190 | Fair 16.5% |