Immigrants from Zaire vs French American Indian Family Poverty
COMPARE
Immigrants from Zaire
French American Indian
Family Poverty
Family Poverty Comparison
Immigrants from Zaire
French American Indians
10.7%
FAMILY POVERTY
0.3/ 100
METRIC RATING
252nd/ 347
METRIC RANK
10.2%
FAMILY POVERTY
1.5/ 100
METRIC RATING
238th/ 347
METRIC RANK
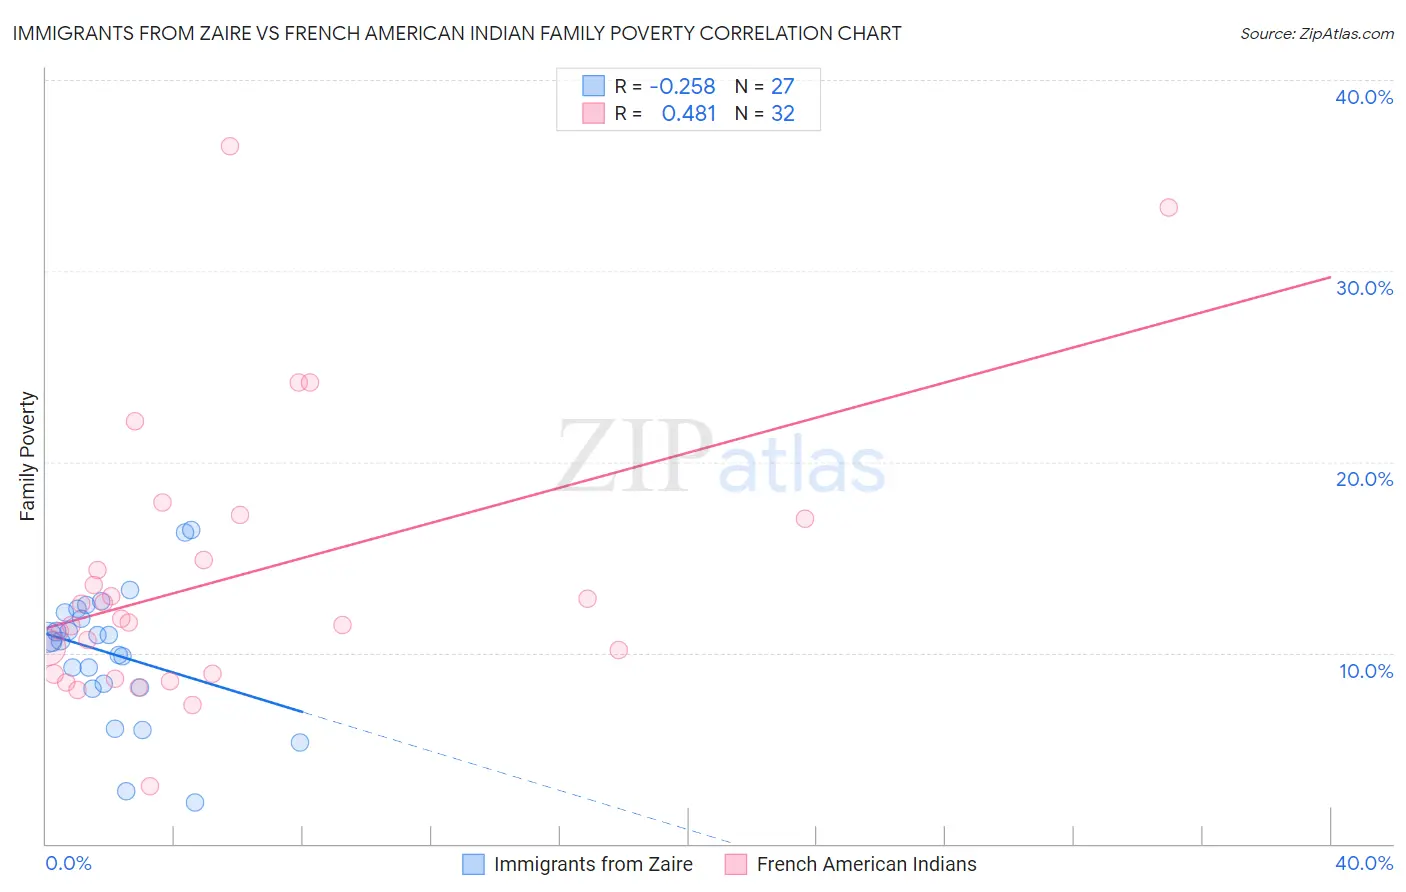
Immigrants from Zaire vs French American Indian Family Poverty Correlation Chart
The statistical analysis conducted on geographies consisting of 107,226,893 people shows a weak negative correlation between the proportion of Immigrants from Zaire and poverty level among families in the United States with a correlation coefficient (R) of -0.258 and weighted average of 10.7%. Similarly, the statistical analysis conducted on geographies consisting of 131,838,011 people shows a moderate positive correlation between the proportion of French American Indians and poverty level among families in the United States with a correlation coefficient (R) of 0.481 and weighted average of 10.2%, a difference of 4.9%.
Family Poverty Correlation Summary
| Measurement | Immigrants from Zaire | French American Indian |
| Minimum | 2.1% | 3.0% |
| Maximum | 16.4% | 36.5% |
| Range | 14.3% | 33.5% |
| Mean | 9.9% | 13.9% |
| Median | 10.6% | 11.7% |
| Interquartile 25% (IQ1) | 8.2% | 8.9% |
| Interquartile 75% (IQ3) | 12.1% | 16.0% |
| Interquartile Range (IQR) | 3.9% | 7.1% |
| Standard Deviation (Sample) | 3.4% | 7.3% |
| Standard Deviation (Population) | 3.4% | 7.2% |
Demographics Similar to Immigrants from Zaire and French American Indians by Family Poverty
In terms of family poverty, the demographic groups most similar to Immigrants from Zaire are Immigrants from Western Africa (10.7%, a difference of 0.11%), Iroquois (10.7%, a difference of 0.12%), Salvadoran (10.7%, a difference of 0.40%), Ecuadorian (10.8%, a difference of 0.41%), and Immigrants from Liberia (10.8%, a difference of 0.78%). Similarly, the demographic groups most similar to French American Indians are Potawatomi (10.2%, a difference of 0.040%), Immigrants from the Azores (10.3%, a difference of 0.35%), Immigrants from Laos (10.2%, a difference of 0.36%), Ghanaian (10.3%, a difference of 0.43%), and Immigrants from Nigeria (10.2%, a difference of 0.63%).
| Demographics | Rating | Rank | Family Poverty |
| Nigerians | 2.0 /100 | #235 | Tragic 10.1% |
| Immigrants | Nigeria | 1.9 /100 | #236 | Tragic 10.2% |
| Immigrants | Laos | 1.7 /100 | #237 | Tragic 10.2% |
| French American Indians | 1.5 /100 | #238 | Tragic 10.2% |
| Potawatomi | 1.5 /100 | #239 | Tragic 10.2% |
| Immigrants | Azores | 1.4 /100 | #240 | Tragic 10.3% |
| Ghanaians | 1.3 /100 | #241 | Tragic 10.3% |
| Alaska Natives | 1.0 /100 | #242 | Tragic 10.4% |
| Nepalese | 0.8 /100 | #243 | Tragic 10.4% |
| Cree | 0.7 /100 | #244 | Tragic 10.5% |
| Immigrants | Burma/Myanmar | 0.6 /100 | #245 | Tragic 10.5% |
| Cherokee | 0.5 /100 | #246 | Tragic 10.6% |
| Liberians | 0.4 /100 | #247 | Tragic 10.6% |
| Nicaraguans | 0.4 /100 | #248 | Tragic 10.6% |
| Cubans | 0.4 /100 | #249 | Tragic 10.6% |
| Salvadorans | 0.3 /100 | #250 | Tragic 10.7% |
| Iroquois | 0.3 /100 | #251 | Tragic 10.7% |
| Immigrants | Zaire | 0.3 /100 | #252 | Tragic 10.7% |
| Immigrants | Western Africa | 0.3 /100 | #253 | Tragic 10.7% |
| Ecuadorians | 0.2 /100 | #254 | Tragic 10.8% |
| Immigrants | Liberia | 0.2 /100 | #255 | Tragic 10.8% |