Immigrants from Yemen vs Spanish American Indian Single Male Poverty
COMPARE
Immigrants from Yemen
Spanish American Indian
Single Male Poverty
Single Male Poverty Comparison
Immigrants from Yemen
Spanish American Indians
16.9%
SINGLE MALE POVERTY
0.0/ 100
METRIC RATING
324th/ 347
METRIC RANK
12.1%
SINGLE MALE POVERTY
98.0/ 100
METRIC RATING
92nd/ 347
METRIC RANK
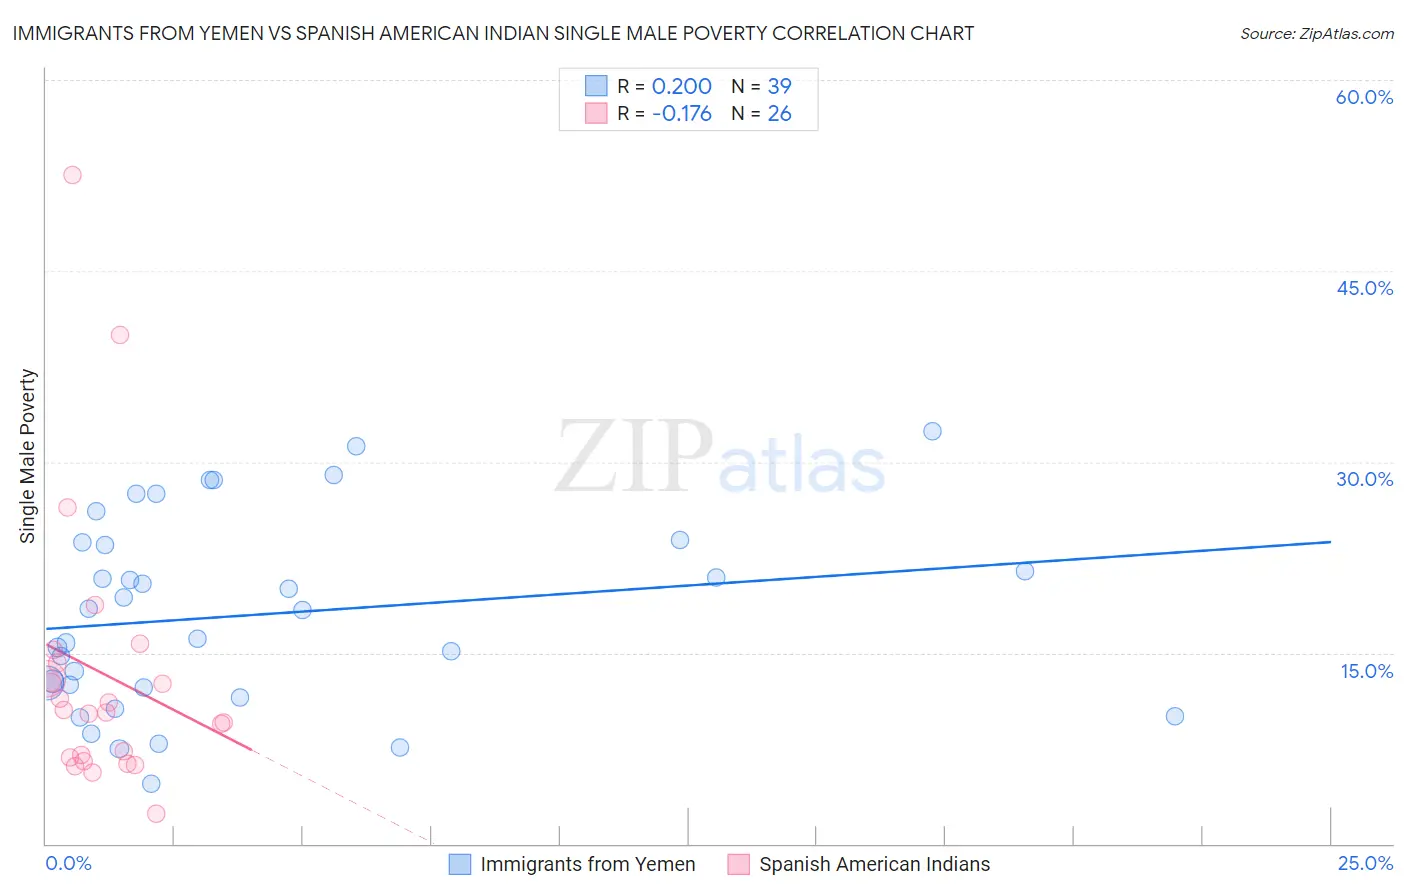
Immigrants from Yemen vs Spanish American Indian Single Male Poverty Correlation Chart
The statistical analysis conducted on geographies consisting of 80,158,341 people shows a poor positive correlation between the proportion of Immigrants from Yemen and poverty level among single males in the United States with a correlation coefficient (R) of 0.200 and weighted average of 16.9%. Similarly, the statistical analysis conducted on geographies consisting of 71,838,653 people shows a poor negative correlation between the proportion of Spanish American Indians and poverty level among single males in the United States with a correlation coefficient (R) of -0.176 and weighted average of 12.1%, a difference of 38.9%.
Single Male Poverty Correlation Summary
| Measurement | Immigrants from Yemen | Spanish American Indian |
| Minimum | 4.7% | 2.3% |
| Maximum | 32.4% | 52.6% |
| Range | 27.7% | 50.3% |
| Mean | 18.0% | 13.4% |
| Median | 18.3% | 10.4% |
| Interquartile 25% (IQ1) | 12.3% | 6.8% |
| Interquartile 75% (IQ3) | 23.7% | 14.2% |
| Interquartile Range (IQR) | 11.4% | 7.4% |
| Standard Deviation (Sample) | 7.4% | 11.0% |
| Standard Deviation (Population) | 7.3% | 10.8% |
Similar Demographics by Single Male Poverty
Demographics Similar to Immigrants from Yemen by Single Male Poverty
In terms of single male poverty, the demographic groups most similar to Immigrants from Yemen are Creek (16.8%, a difference of 0.11%), Choctaw (17.0%, a difference of 0.72%), Shoshone (16.7%, a difference of 1.1%), Central American Indian (17.2%, a difference of 2.3%), and Osage (16.5%, a difference of 2.4%).
| Demographics | Rating | Rank | Single Male Poverty |
| Blacks/African Americans | 0.0 /100 | #317 | Tragic 16.2% |
| Chickasaw | 0.0 /100 | #318 | Tragic 16.3% |
| Chippewa | 0.0 /100 | #319 | Tragic 16.4% |
| Marshallese | 0.0 /100 | #320 | Tragic 16.4% |
| Osage | 0.0 /100 | #321 | Tragic 16.5% |
| Shoshone | 0.0 /100 | #322 | Tragic 16.7% |
| Creek | 0.0 /100 | #323 | Tragic 16.8% |
| Immigrants | Yemen | 0.0 /100 | #324 | Tragic 16.9% |
| Choctaw | 0.0 /100 | #325 | Tragic 17.0% |
| Central American Indians | 0.0 /100 | #326 | Tragic 17.2% |
| Menominee | 0.0 /100 | #327 | Tragic 17.7% |
| Kiowa | 0.0 /100 | #328 | Tragic 18.3% |
| Colville | 0.0 /100 | #329 | Tragic 18.4% |
| Cajuns | 0.0 /100 | #330 | Tragic 19.1% |
| Paiute | 0.0 /100 | #331 | Tragic 19.3% |
Demographics Similar to Spanish American Indians by Single Male Poverty
In terms of single male poverty, the demographic groups most similar to Spanish American Indians are Immigrants from Bosnia and Herzegovina (12.1%, a difference of 0.060%), Immigrants from Turkey (12.1%, a difference of 0.11%), Immigrants from Ireland (12.1%, a difference of 0.16%), South American Indian (12.1%, a difference of 0.16%), and Colombian (12.2%, a difference of 0.18%).
| Demographics | Rating | Rank | Single Male Poverty |
| Turks | 98.5 /100 | #85 | Exceptional 12.1% |
| Immigrants | Israel | 98.5 /100 | #86 | Exceptional 12.1% |
| South Americans | 98.5 /100 | #87 | Exceptional 12.1% |
| Immigrants | Eritrea | 98.5 /100 | #88 | Exceptional 12.1% |
| Immigrants | Ireland | 98.3 /100 | #89 | Exceptional 12.1% |
| South American Indians | 98.3 /100 | #90 | Exceptional 12.1% |
| Immigrants | Turkey | 98.2 /100 | #91 | Exceptional 12.1% |
| Spanish American Indians | 98.0 /100 | #92 | Exceptional 12.1% |
| Immigrants | Bosnia and Herzegovina | 97.9 /100 | #93 | Exceptional 12.1% |
| Colombians | 97.8 /100 | #94 | Exceptional 12.2% |
| Mongolians | 97.7 /100 | #95 | Exceptional 12.2% |
| Immigrants | Sweden | 97.5 /100 | #96 | Exceptional 12.2% |
| Immigrants | Italy | 97.4 /100 | #97 | Exceptional 12.2% |
| Guamanians/Chamorros | 97.4 /100 | #98 | Exceptional 12.2% |
| Immigrants | Cuba | 97.3 /100 | #99 | Exceptional 12.2% |