Immigrants from Yemen vs South American Receiving Food Stamps
COMPARE
Immigrants from Yemen
South American
Receiving Food Stamps
Receiving Food Stamps Comparison
Immigrants from Yemen
South Americans
21.6%
RECEIVING FOOD STAMPS
0.0/ 100
METRIC RATING
342nd/ 347
METRIC RANK
12.4%
RECEIVING FOOD STAMPS
16.0/ 100
METRIC RATING
207th/ 347
METRIC RANK
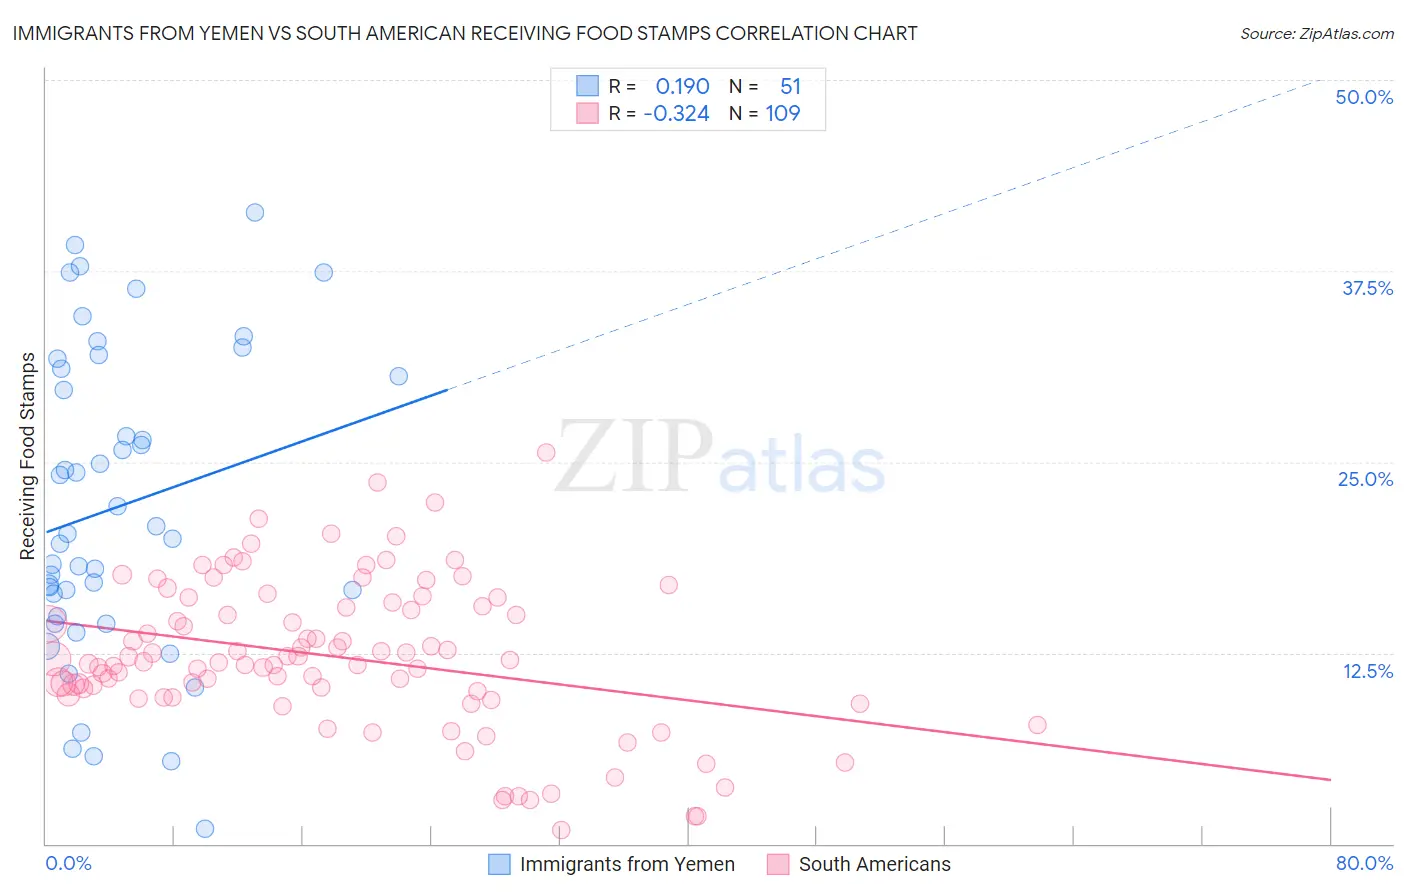
Immigrants from Yemen vs South American Receiving Food Stamps Correlation Chart
The statistical analysis conducted on geographies consisting of 82,428,018 people shows a poor positive correlation between the proportion of Immigrants from Yemen and percentage of population receiving government assistance and/or food stamps in the United States with a correlation coefficient (R) of 0.190 and weighted average of 21.6%. Similarly, the statistical analysis conducted on geographies consisting of 491,814,121 people shows a mild negative correlation between the proportion of South Americans and percentage of population receiving government assistance and/or food stamps in the United States with a correlation coefficient (R) of -0.324 and weighted average of 12.4%, a difference of 74.2%.
Receiving Food Stamps Correlation Summary
| Measurement | Immigrants from Yemen | South American |
| Minimum | 1.0% | 0.90% |
| Maximum | 41.3% | 25.6% |
| Range | 40.3% | 24.7% |
| Mean | 22.1% | 12.2% |
| Median | 20.3% | 11.9% |
| Interquartile 25% (IQ1) | 14.9% | 9.7% |
| Interquartile 75% (IQ3) | 31.1% | 15.6% |
| Interquartile Range (IQR) | 16.2% | 6.0% |
| Standard Deviation (Sample) | 10.0% | 4.9% |
| Standard Deviation (Population) | 9.9% | 4.9% |
Similar Demographics by Receiving Food Stamps
Demographics Similar to Immigrants from Yemen by Receiving Food Stamps
In terms of receiving food stamps, the demographic groups most similar to Immigrants from Yemen are Hopi (21.6%, a difference of 0.41%), Tohono O'odham (21.5%, a difference of 0.78%), Yakama (21.4%, a difference of 1.0%), Dominican (21.4%, a difference of 1.3%), and Immigrants from Dominican Republic (22.1%, a difference of 2.2%).
| Demographics | Rating | Rank | Receiving Food Stamps |
| Inupiat | 0.0 /100 | #333 | Tragic 20.1% |
| Yuman | 0.0 /100 | #334 | Tragic 20.2% |
| Immigrants | Cuba | 0.0 /100 | #335 | Tragic 20.8% |
| Navajo | 0.0 /100 | #336 | Tragic 21.1% |
| Cape Verdeans | 0.0 /100 | #337 | Tragic 21.1% |
| Dominicans | 0.0 /100 | #338 | Tragic 21.4% |
| Yakama | 0.0 /100 | #339 | Tragic 21.4% |
| Tohono O'odham | 0.0 /100 | #340 | Tragic 21.5% |
| Hopi | 0.0 /100 | #341 | Tragic 21.6% |
| Immigrants | Yemen | 0.0 /100 | #342 | Tragic 21.6% |
| Immigrants | Dominican Republic | 0.0 /100 | #343 | Tragic 22.1% |
| Lumbee | 0.0 /100 | #344 | Tragic 22.9% |
| Immigrants | Cabo Verde | 0.0 /100 | #345 | Tragic 23.8% |
| Puerto Ricans | 0.0 /100 | #346 | Tragic 26.0% |
| Yup'ik | 0.0 /100 | #347 | Tragic 32.7% |
Demographics Similar to South Americans by Receiving Food Stamps
In terms of receiving food stamps, the demographic groups most similar to South Americans are Immigrants from Thailand (12.4%, a difference of 0.26%), Aleut (12.4%, a difference of 0.33%), Potawatomi (12.5%, a difference of 0.36%), Nonimmigrants (12.4%, a difference of 0.39%), and Shoshone (12.4%, a difference of 0.42%).
| Demographics | Rating | Rank | Receiving Food Stamps |
| Sierra Leoneans | 23.6 /100 | #200 | Fair 12.2% |
| Ugandans | 22.5 /100 | #201 | Fair 12.2% |
| Immigrants | Venezuela | 20.1 /100 | #202 | Fair 12.3% |
| Shoshone | 17.7 /100 | #203 | Poor 12.4% |
| Immigrants | Nonimmigrants | 17.6 /100 | #204 | Poor 12.4% |
| Aleuts | 17.3 /100 | #205 | Poor 12.4% |
| Immigrants | Thailand | 17.0 /100 | #206 | Poor 12.4% |
| South Americans | 16.0 /100 | #207 | Poor 12.4% |
| Potawatomi | 14.6 /100 | #208 | Poor 12.5% |
| Immigrants | Sierra Leone | 12.9 /100 | #209 | Poor 12.5% |
| Immigrants | Uruguay | 12.8 /100 | #210 | Poor 12.5% |
| Colombians | 10.2 /100 | #211 | Poor 12.6% |
| Malaysians | 8.5 /100 | #212 | Tragic 12.7% |
| Moroccans | 7.6 /100 | #213 | Tragic 12.8% |
| Immigrants | Africa | 7.6 /100 | #214 | Tragic 12.8% |