Immigrants from Yemen vs Nigerian Child Poverty Among Boys Under 16
COMPARE
Immigrants from Yemen
Nigerian
Child Poverty Among Boys Under 16
Child Poverty Among Boys Under 16 Comparison
Immigrants from Yemen
Nigerians
28.9%
CHILD POVERTY AMONG BOYS UNDER 16
0.0/ 100
METRIC RATING
341st/ 347
METRIC RANK
18.5%
CHILD POVERTY AMONG BOYS UNDER 16
1.1/ 100
METRIC RATING
234th/ 347
METRIC RANK
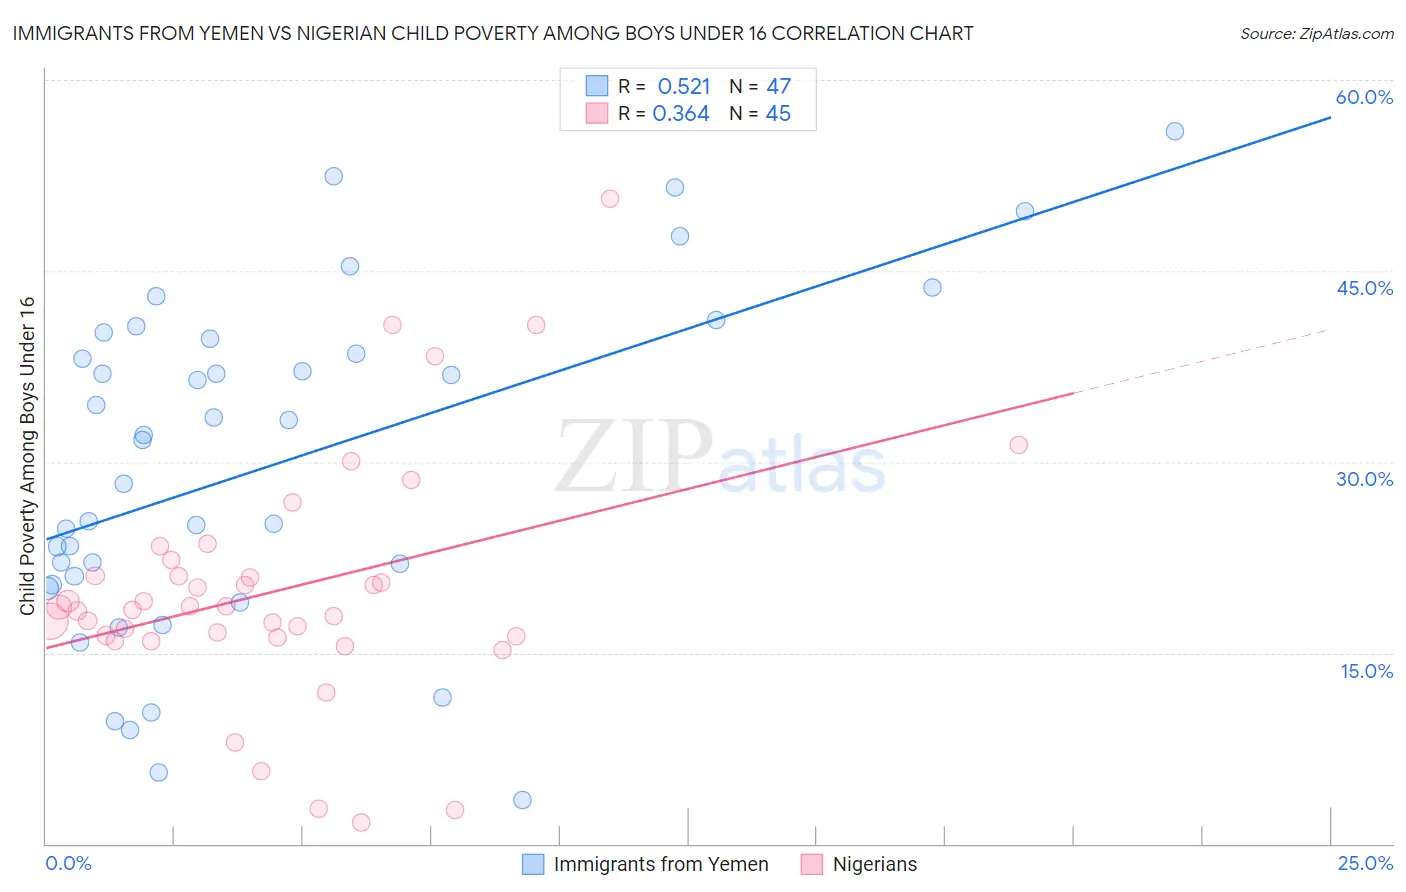
Immigrants from Yemen vs Nigerian Child Poverty Among Boys Under 16 Correlation Chart
The statistical analysis conducted on geographies consisting of 82,297,858 people shows a substantial positive correlation between the proportion of Immigrants from Yemen and poverty level among boys under the age of 16 in the United States with a correlation coefficient (R) of 0.521 and weighted average of 28.9%. Similarly, the statistical analysis conducted on geographies consisting of 329,481,390 people shows a mild positive correlation between the proportion of Nigerians and poverty level among boys under the age of 16 in the United States with a correlation coefficient (R) of 0.364 and weighted average of 18.5%, a difference of 56.0%.
Child Poverty Among Boys Under 16 Correlation Summary
| Measurement | Immigrants from Yemen | Nigerian |
| Minimum | 3.4% | 1.7% |
| Maximum | 55.9% | 50.6% |
| Range | 52.5% | 48.9% |
| Mean | 29.8% | 19.9% |
| Median | 31.7% | 18.6% |
| Interquartile 25% (IQ1) | 20.4% | 16.2% |
| Interquartile 75% (IQ3) | 39.7% | 21.6% |
| Interquartile Range (IQR) | 19.3% | 5.4% |
| Standard Deviation (Sample) | 13.2% | 9.6% |
| Standard Deviation (Population) | 13.0% | 9.5% |
Similar Demographics by Child Poverty Among Boys Under 16
Demographics Similar to Immigrants from Yemen by Child Poverty Among Boys Under 16
In terms of child poverty among boys under 16, the demographic groups most similar to Immigrants from Yemen are Pima (29.7%, a difference of 3.1%), Navajo (30.3%, a difference of 5.0%), Yuman (30.6%, a difference of 6.2%), Tohono O'odham (31.6%, a difference of 9.4%), and Crow (26.3%, a difference of 9.9%).
| Demographics | Rating | Rank | Child Poverty Among Boys Under 16 |
| Apache | 0.0 /100 | #333 | Tragic 24.5% |
| Blacks/African Americans | 0.0 /100 | #334 | Tragic 24.5% |
| Yup'ik | 0.0 /100 | #335 | Tragic 24.7% |
| Sioux | 0.0 /100 | #336 | Tragic 25.3% |
| Cheyenne | 0.0 /100 | #337 | Tragic 25.8% |
| Hopi | 0.0 /100 | #338 | Tragic 25.9% |
| Houma | 0.0 /100 | #339 | Tragic 26.2% |
| Crow | 0.0 /100 | #340 | Tragic 26.3% |
| Immigrants | Yemen | 0.0 /100 | #341 | Tragic 28.9% |
| Pima | 0.0 /100 | #342 | Tragic 29.7% |
| Navajo | 0.0 /100 | #343 | Tragic 30.3% |
| Yuman | 0.0 /100 | #344 | Tragic 30.6% |
| Tohono O'odham | 0.0 /100 | #345 | Tragic 31.6% |
| Lumbee | 0.0 /100 | #346 | Tragic 31.9% |
| Puerto Ricans | 0.0 /100 | #347 | Tragic 32.8% |
Demographics Similar to Nigerians by Child Poverty Among Boys Under 16
In terms of child poverty among boys under 16, the demographic groups most similar to Nigerians are Immigrants from Nigeria (18.4%, a difference of 0.25%), Marshallese (18.4%, a difference of 0.44%), American (18.6%, a difference of 0.50%), Sudanese (18.6%, a difference of 0.59%), and Nicaraguan (18.4%, a difference of 0.64%).
| Demographics | Rating | Rank | Child Poverty Among Boys Under 16 |
| Bermudans | 2.5 /100 | #227 | Tragic 18.1% |
| Immigrants | Nonimmigrants | 2.2 /100 | #228 | Tragic 18.2% |
| Immigrants | Micronesia | 1.8 /100 | #229 | Tragic 18.3% |
| Fijians | 1.8 /100 | #230 | Tragic 18.3% |
| Nicaraguans | 1.4 /100 | #231 | Tragic 18.4% |
| Marshallese | 1.3 /100 | #232 | Tragic 18.4% |
| Immigrants | Nigeria | 1.2 /100 | #233 | Tragic 18.4% |
| Nigerians | 1.1 /100 | #234 | Tragic 18.5% |
| Americans | 0.9 /100 | #235 | Tragic 18.6% |
| Sudanese | 0.9 /100 | #236 | Tragic 18.6% |
| Immigrants | Eritrea | 0.8 /100 | #237 | Tragic 18.6% |
| Immigrants | Laos | 0.8 /100 | #238 | Tragic 18.7% |
| Cape Verdeans | 0.7 /100 | #239 | Tragic 18.7% |
| Immigrants | Cuba | 0.6 /100 | #240 | Tragic 18.8% |
| Immigrants | Sudan | 0.6 /100 | #241 | Tragic 18.8% |