Immigrants from Yemen vs Inupiat Child Poverty Under the Age of 16

COMPARE

Immigrants from Yemen
Race
Ancestry
AfghanAfricanAlaska NativeAlaskan AthabascanAlbanianAleutAlsatianAmericanApacheArabArapahoArgentineanArmenianAssyrian/Chaldean/SyriacAustralianAustrianBahamianBangladeshiBarbadianBasqueBelgianBelizeanBermudanBhutaneseBlackfeetBolivianBrazilianBritishBritish West IndianBulgarianBurmeseCajunCambodianCanadianCape VerdeanCarpatho RusynCelticCentral AmericanCentral American IndianCherokeeCheyenneChickasawChileanChineseChippewaChoctawColombianColvilleComancheCosta RicanCreeCreekCroatianCrowCubanCypriotCzechCzechoslovakianDanishDelawareDominicanDutchDutch West IndianEastern EuropeanEcuadorianEgyptianEnglishEstonianEthiopianEuropeanFijianFilipinoFinnishFrenchFrench American IndianFrench CanadianGermanGerman RussianGhanaianGreekGuamanian/ChamorroGuatemalanGuyaneseHaitianHmongHonduranHopiHoumaHungarianIcelanderIndian (Asian)IndonesianIranianIraqiIrishIroquoisIsraeliItalianJamaicanJapaneseJordanianKenyanKiowaKoreanLaotianLatvianLebaneseLiberianLithuanianLumbeeLuxembourgerMacedonianMalaysianMalteseMarshalleseMenomineeMexicanMexican American IndianMongolianMoroccanNative HawaiianNavajoNepaleseNew ZealanderNicaraguanNigerianNorthern EuropeanNorwegianOkinawanOsageOttawaPaiutePakistaniPalestinianPanamanianParaguayanPennsylvania GermanPeruvianPimaPolishPortuguesePotawatomiPuebloPuerto RicanPuget Sound SalishRomanianRussianSalvadoranSamoanScandinavianScotch-IrishScottishSeminoleSenegaleseSerbianShoshoneSierra LeoneanSiouxSlavicSlovakSloveneSomaliSouth AfricanSouth AmericanSouth American IndianSoviet UnionSpaniardSpanishSpanish AmericanSpanish American IndianSri LankanSubsaharan AfricanSudaneseSwedishSwissSyrianTaiwaneseThaiTlingit-HaidaTohono O'OdhamTonganTrinidadian and TobagonianTsimshianTurkishU.S. Virgin IslanderUgandanUkrainianUruguayanUteVenezuelanVietnameseWelshWest IndianYakamaYaquiYugoslavianYumanYup'ikZimbabwean
Immigration
NonimmigrantsImmigrantsAfghanistanAfricaAlbaniaArgentinaArmeniaAsiaAustraliaAustriaBahamasBangladeshBarbadosBelarusBelgiumBelizeBoliviaBosnia and HerzegovinaBrazilBulgariaBurma/MyanmarCabo VerdeCambodiaCameroonCanadaCaribbeanCentral AmericaChileChinaColombiaCongoCosta RicaCroatiaCubaCzechoslovakiaDenmarkDominicaDominican RepublicEastern AfricaEastern AsiaEastern EuropeEcuadorEgyptEl SalvadorEnglandEritreaEthiopiaEuropeFijiFranceGermanyGhanaGreeceGrenadaGuatemalaGuyanaHaitiHondurasHong KongHungaryIndiaIndonesiaIranIraqIrelandIsraelItalyJamaicaJapanJordanKazakhstanKenyaKoreaKuwaitLaosLatin AmericaLatviaLebanonLiberiaLithuaniaMalaysiaMexicoMicronesiaMiddle AfricaMoldovaMoroccoNepalNetherlandsNicaraguaNigeriaNorth AmericaNorth MacedoniaNorthern AfricaNorthern EuropeNorwayOceaniaPakistanPanamaPeruPhilippinesPolandPortugalRomaniaRussiaSaudi ArabiaScotlandSenegalSerbiaSierra LeoneSingaporeSomaliaSouth AfricaSouth AmericaSouth Central AsiaSouth Eastern AsiaSouthern EuropeSpainSri LankaSt. Vincent and the GrenadinesSudanSwedenSwitzerlandSyriaTaiwanThailandTrinidad and TobagoTurkeyUgandaUkraineUruguayUzbekistanVenezuelaVietnamWest IndiesWestern AfricaWestern AsiaWestern EuropeYemenZaireZimbabweAzores
Inupiat
Race
Ancestry
AfghanAfricanAlaska NativeAlaskan AthabascanAlbanianAleutAlsatianAmericanApacheArabArapahoArgentineanArmenianAssyrian/Chaldean/SyriacAustralianAustrianBahamianBangladeshiBarbadianBasqueBelgianBelizeanBermudanBhutaneseBlackfeetBolivianBrazilianBritishBritish West IndianBulgarianBurmeseCajunCambodianCanadianCape VerdeanCarpatho RusynCelticCentral AmericanCentral American IndianCherokeeCheyenneChickasawChileanChineseChippewaChoctawColombianColvilleComancheCosta RicanCreeCreekCroatianCrowCubanCypriotCzechCzechoslovakianDanishDelawareDominicanDutchDutch West IndianEastern EuropeanEcuadorianEgyptianEnglishEstonianEthiopianEuropeanFijianFilipinoFinnishFrenchFrench American IndianFrench CanadianGermanGerman RussianGhanaianGreekGuamanian/ChamorroGuatemalanGuyaneseHaitianHmongHonduranHopiHoumaHungarianIcelanderIndian (Asian)IndonesianInupiatIranianIraqiIrishIroquoisIsraeliItalianJamaicanJapaneseJordanianKenyanKiowaKoreanLaotianLatvianLebaneseLiberianLithuanianLumbeeLuxembourgerMacedonianMalaysianMalteseMarshalleseMenomineeMexicanMexican American IndianMongolianMoroccanNative HawaiianNavajoNepaleseNew ZealanderNicaraguanNigerianNorthern EuropeanNorwegianOkinawanOsageOttawaPaiutePakistaniPalestinianPanamanianParaguayanPennsylvania GermanPeruvianPimaPolishPortuguesePotawatomiPuebloPuerto RicanPuget Sound SalishRomanianRussianSalvadoranSamoanScandinavianScotch-IrishScottishSeminoleSenegaleseSerbianShoshoneSierra LeoneanSiouxSlavicSlovakSloveneSomaliSouth AfricanSouth AmericanSouth American IndianSoviet UnionSpaniardSpanishSpanish AmericanSpanish American IndianSri LankanSubsaharan AfricanSudaneseSwedishSwissSyrianTaiwaneseThaiTlingit-HaidaTohono O'OdhamTonganTrinidadian and TobagonianTsimshianTurkishU.S. Virgin IslanderUgandanUkrainianUruguayanUteVenezuelanVietnameseWelshWest IndianYakamaYaquiYugoslavianYumanYup'ikZimbabwean
Immigration
NonimmigrantsImmigrantsAfghanistanAfricaAlbaniaArgentinaArmeniaAsiaAustraliaAustriaBahamasBangladeshBarbadosBelarusBelgiumBelizeBoliviaBosnia and HerzegovinaBrazilBulgariaBurma/MyanmarCabo VerdeCambodiaCameroonCanadaCaribbeanCentral AmericaChileChinaColombiaCongoCosta RicaCroatiaCubaCzechoslovakiaDenmarkDominicaDominican RepublicEastern AfricaEastern AsiaEastern EuropeEcuadorEgyptEl SalvadorEnglandEritreaEthiopiaEuropeFijiFranceGermanyGhanaGreeceGrenadaGuatemalaGuyanaHaitiHondurasHong KongHungaryIndiaIndonesiaIranIraqIrelandIsraelItalyJamaicaJapanJordanKazakhstanKenyaKoreaKuwaitLaosLatin AmericaLatviaLebanonLiberiaLithuaniaMalaysiaMexicoMicronesiaMiddle AfricaMoldovaMoroccoNepalNetherlandsNicaraguaNigeriaNorth AmericaNorth MacedoniaNorthern AfricaNorthern EuropeNorwayOceaniaPakistanPanamaPeruPhilippinesPolandPortugalRomaniaRussiaSaudi ArabiaScotlandSenegalSerbiaSierra LeoneSingaporeSomaliaSouth AfricaSouth AmericaSouth Central AsiaSouth Eastern AsiaSouthern EuropeSpainSri LankaSt. Vincent and the GrenadinesSudanSwedenSwitzerlandSyriaTaiwanThailandTrinidad and TobagoTurkeyUgandaUkraineUruguayUzbekistanVenezuelaVietnamWest IndiesWestern AfricaWestern AsiaWestern EuropeZaireZimbabweAzores
Child Poverty Under the Age of 16
Income
Poverty
Unemployment
Labor Participation
Family Structure
Vehicle Availability
Education Level
Disability

Child Poverty Under the Age of 16 Comparison

Immigrants from Yemen

Inupiat

Tragic
Tragic
29.1%
CHILD POVERTY UNDER THE AGE OF 16
0.0/ 100
METRIC RATING
343rd/ 347
METRIC RANK
19.2%
CHILD POVERTY UNDER THE AGE OF 16
0.2/ 100
METRIC RATING
256th/ 347
METRIC RANK

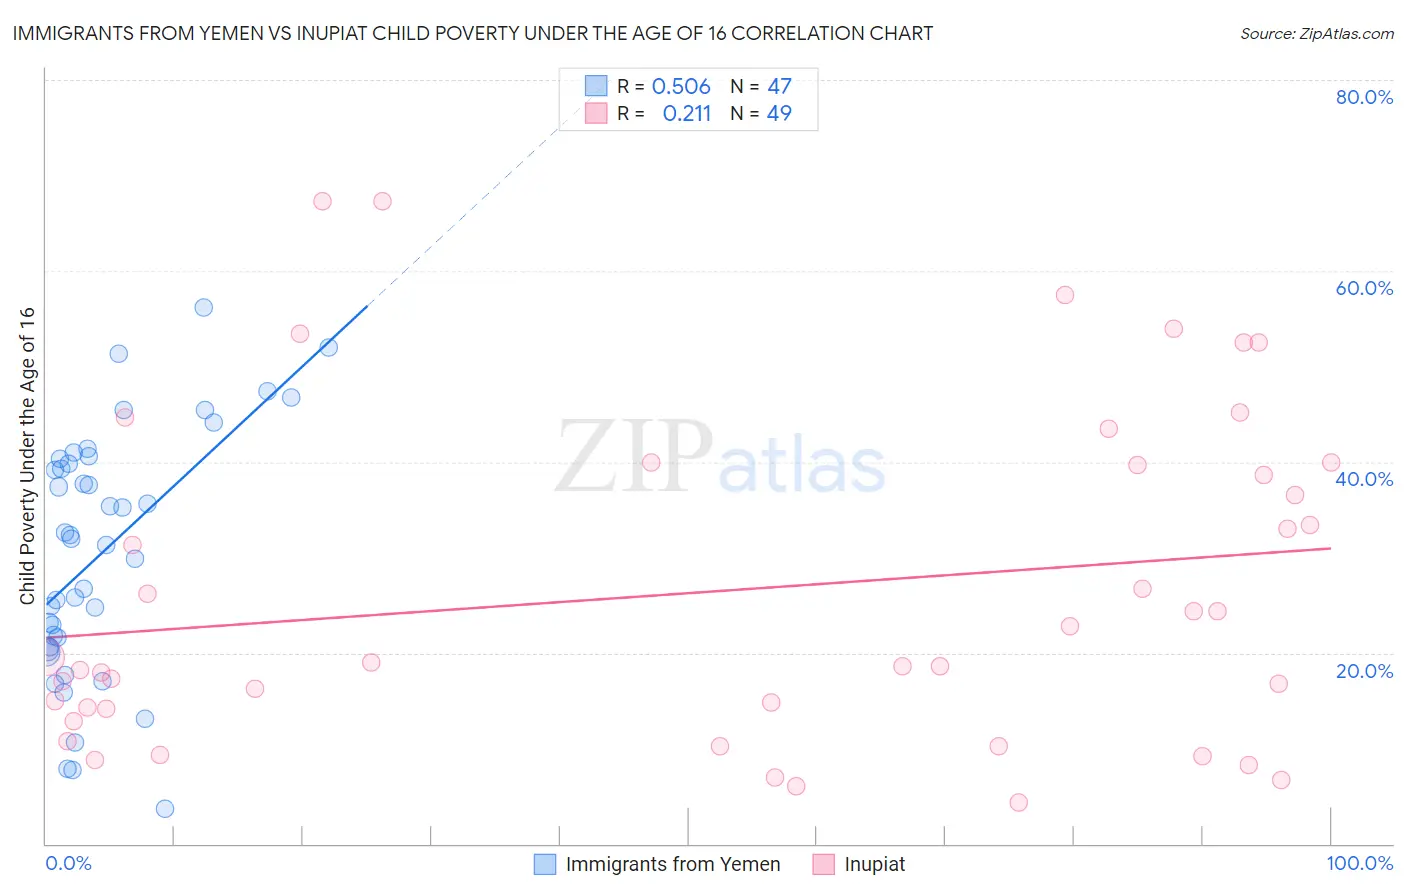
Immigrants from Yemen vs Inupiat Child Poverty Under the Age of 16 Correlation Chart

The statistical analysis conducted on geographies consisting of 82,369,702 people shows a substantial positive correlation between the proportion of Immigrants from Yemen and poverty level among children under the age of 16 in the United States with a correlation coefficient (R) of 0.506 and weighted average of 29.1%. Similarly, the statistical analysis conducted on geographies consisting of 96,193,869 people shows a weak positive correlation between the proportion of Inupiat and poverty level among children under the age of 16 in the United States with a correlation coefficient (R) of 0.211 and weighted average of 19.2%, a difference of 51.4%.
Immigrants from Yemen vs Inupiat Child Poverty Under the Age of 16

Child Poverty Under the Age of 16 Correlation Summary

MeasurementImmigrants from YemenInupiat
Minimum3.6%4.3%
Maximum56.2%67.3%
Range52.6%63.0%
Mean30.5%26.4%
Median31.9%19.0%
Interquartile 25% (IQ1)20.6%13.5%
Interquartile 75% (IQ3)40.4%39.8%
Interquartile Range (IQR)19.8%26.4%
Standard Deviation (Sample)12.8%17.2%
Standard Deviation (Population)12.7%17.0%

Similar Demographics by Child Poverty Under the Age of 16

Demographics Similar to Immigrants from Yemen by Child Poverty Under the Age of 16

In terms of child poverty under the age of 16, the demographic groups most similar to Immigrants from Yemen are Pima (29.0%, a difference of 0.19%), Yuman (28.9%, a difference of 0.46%), Navajo (30.2%, a difference of 4.0%), Lumbee (31.0%, a difference of 6.5%), and Hopi (27.1%, a difference of 7.3%).
DemographicsRating | RankChild Poverty Under the Age of 16
Immigrants | Dominican Republic
0.0
/100
|
#333
Tragic
24.0%
Blacks/African Americans
0.0
/100
|
#334
Tragic
24.4%
Houma
0.0
/100
|
#335
Tragic
24.9%
Yup'ik
0.0
/100
|
#336
Tragic
25.1%
Sioux
0.0
/100
|
#337
Tragic
25.2%
Cheyenne
0.0
/100
|
#338
Tragic
25.4%
Crow
0.0
/100
|
#339
Tragic
26.0%
Hopi
0.0
/100
|
#340
Tragic
27.1%
Yuman
0.0
/100
|
#341
Tragic
28.9%
Pima
0.0
/100
|
#342
Tragic
29.0%
Immigrants | Yemen
0.0
/100
|
#343
Tragic
29.1%
Navajo
0.0
/100
|
#344
Tragic
30.2%
Lumbee
0.0
/100
|
#345
Tragic
31.0%
Tohono O'odham
0.0
/100
|
#346
Tragic
31.7%
Puerto Ricans
0.0
/100
|
#347
Tragic
32.5%

Demographics Similar to Inupiat by Child Poverty Under the Age of 16

In terms of child poverty under the age of 16, the demographic groups most similar to Inupiat are Ottawa (19.2%, a difference of 0.020%), Trinidadian and Tobagonian (19.2%, a difference of 0.090%), Spanish American (19.2%, a difference of 0.090%), Immigrants from Western Africa (19.2%, a difference of 0.26%), and Salvadoran (19.1%, a difference of 0.50%).
DemographicsRating | RankChild Poverty Under the Age of 16
Potawatomi
0.3
/100
|
#249
Tragic
19.0%
Immigrants | Middle Africa
0.3
/100
|
#250
Tragic
19.0%
Immigrants | Ghana
0.3
/100
|
#251
Tragic
19.1%
Immigrants | Trinidad and Tobago
0.3
/100
|
#252
Tragic
19.1%
Salvadorans
0.3
/100
|
#253
Tragic
19.1%
Immigrants | Western Africa
0.2
/100
|
#254
Tragic
19.2%
Trinidadians and Tobagonians
0.2
/100
|
#255
Tragic
19.2%
Inupiat
0.2
/100
|
#256
Tragic
19.2%
Ottawa
0.2
/100
|
#257
Tragic
19.2%
Spanish Americans
0.2
/100
|
#258
Tragic
19.2%
Mexican American Indians
0.2
/100
|
#259
Tragic
19.3%
Guyanese
0.2
/100
|
#260
Tragic
19.3%
Immigrants | Burma/Myanmar
0.1
/100
|
#261
Tragic
19.4%
Immigrants | Guyana
0.1
/100
|
#262
Tragic
19.4%
Vietnamese
0.1
/100
|
#263
Tragic
19.4%