Immigrants from Yemen vs Immigrants from Barbados Child Poverty Among Girls Under 16
COMPARE
Immigrants from Yemen
Immigrants from Barbados
Child Poverty Among Girls Under 16
Child Poverty Among Girls Under 16 Comparison
Immigrants from Yemen
Immigrants from Barbados
29.5%
CHILD POVERTY AMONG GIRLS UNDER 16
0.0/ 100
METRIC RATING
343rd/ 347
METRIC RANK
19.9%
CHILD POVERTY AMONG GIRLS UNDER 16
0.1/ 100
METRIC RATING
271st/ 347
METRIC RANK
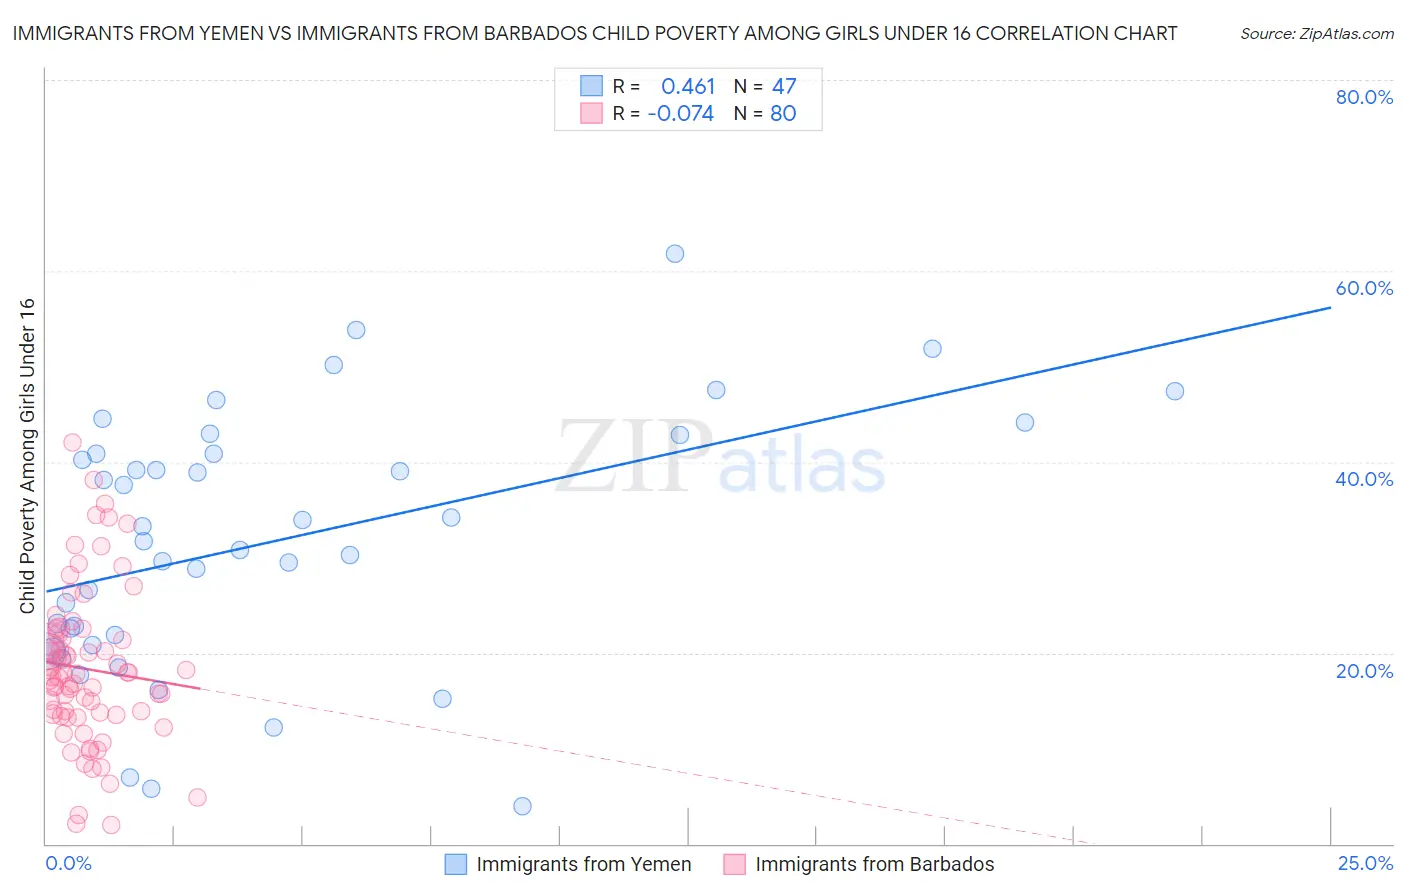
Immigrants from Yemen vs Immigrants from Barbados Child Poverty Among Girls Under 16 Correlation Chart
The statistical analysis conducted on geographies consisting of 82,295,709 people shows a moderate positive correlation between the proportion of Immigrants from Yemen and poverty level among girls under the age of 16 in the United States with a correlation coefficient (R) of 0.461 and weighted average of 29.5%. Similarly, the statistical analysis conducted on geographies consisting of 112,076,716 people shows a slight negative correlation between the proportion of Immigrants from Barbados and poverty level among girls under the age of 16 in the United States with a correlation coefficient (R) of -0.074 and weighted average of 19.9%, a difference of 47.9%.
Child Poverty Among Girls Under 16 Correlation Summary
| Measurement | Immigrants from Yemen | Immigrants from Barbados |
| Minimum | 3.9% | 2.0% |
| Maximum | 61.8% | 42.0% |
| Range | 57.9% | 40.0% |
| Mean | 31.7% | 18.3% |
| Median | 31.7% | 17.6% |
| Interquartile 25% (IQ1) | 20.8% | 13.5% |
| Interquartile 75% (IQ3) | 40.8% | 21.7% |
| Interquartile Range (IQR) | 20.0% | 8.2% |
| Standard Deviation (Sample) | 13.4% | 8.1% |
| Standard Deviation (Population) | 13.2% | 8.1% |
Similar Demographics by Child Poverty Among Girls Under 16
Demographics Similar to Immigrants from Yemen by Child Poverty Among Girls Under 16
In terms of child poverty among girls under 16, the demographic groups most similar to Immigrants from Yemen are Navajo (30.5%, a difference of 3.3%), Lumbee (30.7%, a difference of 4.1%), Pima (28.2%, a difference of 4.5%), Hopi (27.9%, a difference of 5.9%), and Tohono O'odham (31.6%, a difference of 7.2%).
| Demographics | Rating | Rank | Child Poverty Among Girls Under 16 |
| Blacks/African Americans | 0.0 /100 | #333 | Tragic 24.7% |
| Menominee | 0.0 /100 | #334 | Tragic 25.0% |
| Pueblo | 0.0 /100 | #335 | Tragic 25.2% |
| Sioux | 0.0 /100 | #336 | Tragic 25.6% |
| Yup'ik | 0.0 /100 | #337 | Tragic 25.8% |
| Cheyenne | 0.0 /100 | #338 | Tragic 26.3% |
| Crow | 0.0 /100 | #339 | Tragic 26.4% |
| Yuman | 0.0 /100 | #340 | Tragic 27.1% |
| Hopi | 0.0 /100 | #341 | Tragic 27.9% |
| Pima | 0.0 /100 | #342 | Tragic 28.2% |
| Immigrants | Yemen | 0.0 /100 | #343 | Tragic 29.5% |
| Navajo | 0.0 /100 | #344 | Tragic 30.5% |
| Lumbee | 0.0 /100 | #345 | Tragic 30.7% |
| Tohono O'odham | 0.0 /100 | #346 | Tragic 31.6% |
| Puerto Ricans | 0.0 /100 | #347 | Tragic 32.7% |
Demographics Similar to Immigrants from Barbados by Child Poverty Among Girls Under 16
In terms of child poverty among girls under 16, the demographic groups most similar to Immigrants from Barbados are Cherokee (19.9%, a difference of 0.10%), Immigrants from El Salvador (20.0%, a difference of 0.11%), Liberian (19.9%, a difference of 0.29%), Bangladeshi (20.0%, a difference of 0.31%), and Spanish American Indian (19.9%, a difference of 0.38%).
| Demographics | Rating | Rank | Child Poverty Among Girls Under 16 |
| Jamaicans | 0.1 /100 | #264 | Tragic 19.7% |
| Immigrants | Jamaica | 0.1 /100 | #265 | Tragic 19.8% |
| Spanish Americans | 0.1 /100 | #266 | Tragic 19.8% |
| Immigrants | Bangladesh | 0.1 /100 | #267 | Tragic 19.9% |
| Spanish American Indians | 0.1 /100 | #268 | Tragic 19.9% |
| Liberians | 0.1 /100 | #269 | Tragic 19.9% |
| Cherokee | 0.1 /100 | #270 | Tragic 19.9% |
| Immigrants | Barbados | 0.1 /100 | #271 | Tragic 19.9% |
| Immigrants | El Salvador | 0.1 /100 | #272 | Tragic 20.0% |
| Bangladeshis | 0.1 /100 | #273 | Tragic 20.0% |
| Immigrants | St. Vincent and the Grenadines | 0.0 /100 | #274 | Tragic 20.1% |
| Sub-Saharan Africans | 0.0 /100 | #275 | Tragic 20.1% |
| Comanche | 0.0 /100 | #276 | Tragic 20.2% |
| Belizeans | 0.0 /100 | #277 | Tragic 20.2% |
| Barbadians | 0.0 /100 | #278 | Tragic 20.2% |