Immigrants from Western Europe vs Tohono O'odham Child Poverty Among Boys Under 16
COMPARE
Immigrants from Western Europe
Tohono O'odham
Child Poverty Among Boys Under 16
Child Poverty Among Boys Under 16 Comparison
Immigrants from Western Europe
Tohono O'odham
15.4%
CHILD POVERTY AMONG BOYS UNDER 16
90.0/ 100
METRIC RATING
131st/ 347
METRIC RANK
31.6%
CHILD POVERTY AMONG BOYS UNDER 16
0.0/ 100
METRIC RATING
345th/ 347
METRIC RANK
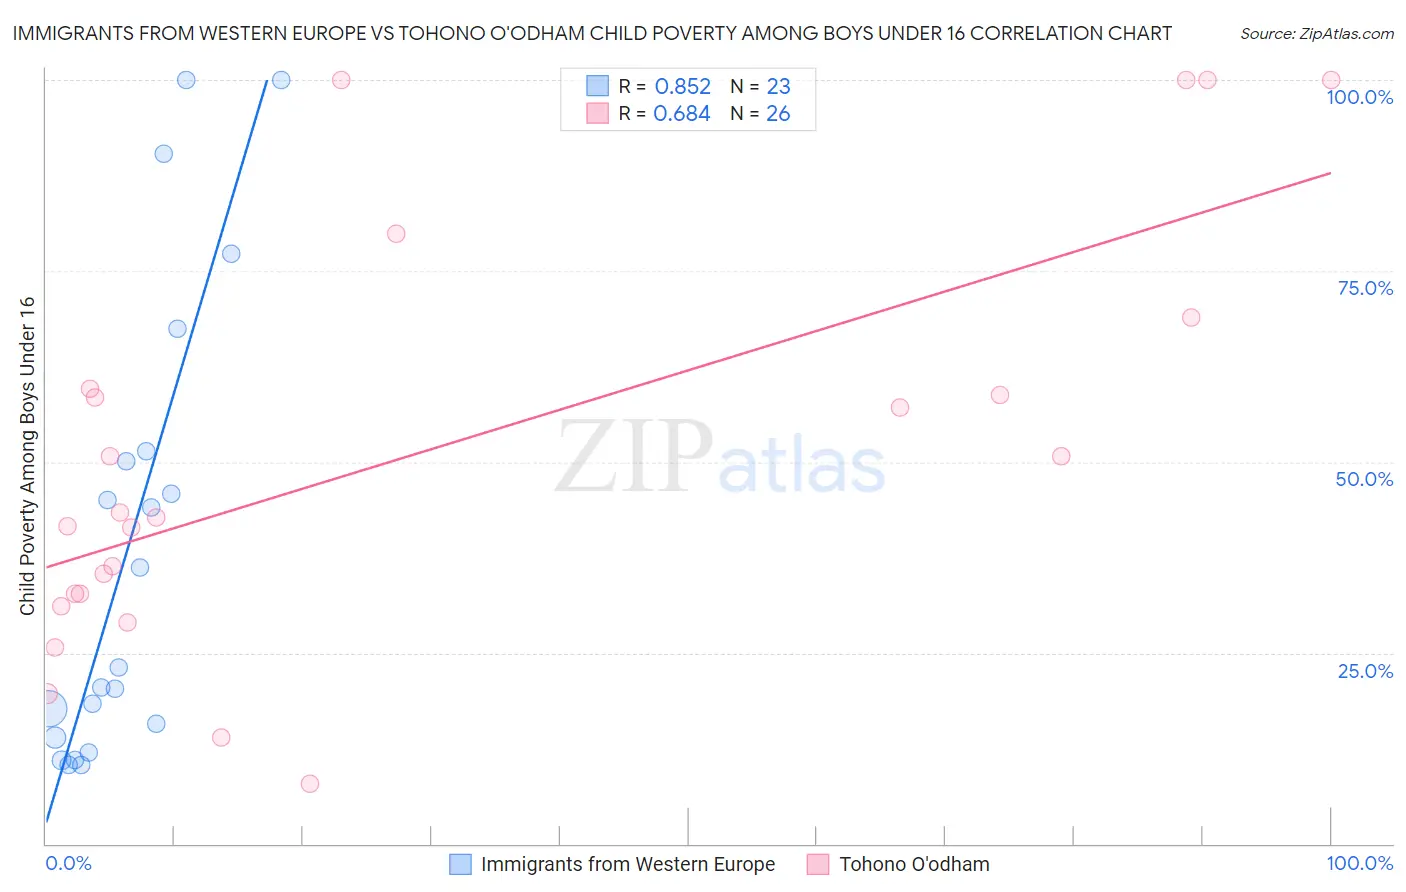
Immigrants from Western Europe vs Tohono O'odham Child Poverty Among Boys Under 16 Correlation Chart
The statistical analysis conducted on geographies consisting of 481,702,204 people shows a very strong positive correlation between the proportion of Immigrants from Western Europe and poverty level among boys under the age of 16 in the United States with a correlation coefficient (R) of 0.852 and weighted average of 15.4%. Similarly, the statistical analysis conducted on geographies consisting of 58,610,464 people shows a significant positive correlation between the proportion of Tohono O'odham and poverty level among boys under the age of 16 in the United States with a correlation coefficient (R) of 0.684 and weighted average of 31.6%, a difference of 104.6%.
Child Poverty Among Boys Under 16 Correlation Summary
| Measurement | Immigrants from Western Europe | Tohono O'odham |
| Minimum | 10.3% | 7.9% |
| Maximum | 100.0% | 100.0% |
| Range | 89.7% | 92.1% |
| Mean | 38.8% | 50.7% |
| Median | 23.0% | 43.1% |
| Interquartile 25% (IQ1) | 13.9% | 32.7% |
| Interquartile 75% (IQ3) | 51.3% | 59.6% |
| Interquartile Range (IQR) | 37.4% | 26.9% |
| Standard Deviation (Sample) | 29.9% | 26.9% |
| Standard Deviation (Population) | 29.3% | 26.4% |
Similar Demographics by Child Poverty Among Boys Under 16
Demographics Similar to Immigrants from Western Europe by Child Poverty Among Boys Under 16
In terms of child poverty among boys under 16, the demographic groups most similar to Immigrants from Western Europe are Mongolian (15.4%, a difference of 0.060%), Immigrants from Brazil (15.4%, a difference of 0.080%), Canadian (15.4%, a difference of 0.20%), Carpatho Rusyn (15.4%, a difference of 0.39%), and Palestinian (15.4%, a difference of 0.43%).
| Demographics | Rating | Rank | Child Poverty Among Boys Under 16 |
| Tlingit-Haida | 92.2 /100 | #124 | Exceptional 15.3% |
| Czechoslovakians | 92.1 /100 | #125 | Exceptional 15.3% |
| Palestinians | 91.3 /100 | #126 | Exceptional 15.4% |
| Carpatho Rusyns | 91.1 /100 | #127 | Exceptional 15.4% |
| Canadians | 90.6 /100 | #128 | Exceptional 15.4% |
| Immigrants | Brazil | 90.3 /100 | #129 | Exceptional 15.4% |
| Mongolians | 90.2 /100 | #130 | Exceptional 15.4% |
| Immigrants | Western Europe | 90.0 /100 | #131 | Exceptional 15.4% |
| Immigrants | Kazakhstan | 88.7 /100 | #132 | Excellent 15.5% |
| Welsh | 88.3 /100 | #133 | Excellent 15.5% |
| Peruvians | 88.1 /100 | #134 | Excellent 15.5% |
| Portuguese | 87.5 /100 | #135 | Excellent 15.5% |
| Icelanders | 87.5 /100 | #136 | Excellent 15.5% |
| Immigrants | Spain | 87.1 /100 | #137 | Excellent 15.6% |
| Immigrants | Southern Europe | 86.5 /100 | #138 | Excellent 15.6% |
Demographics Similar to Tohono O'odham by Child Poverty Among Boys Under 16
In terms of child poverty among boys under 16, the demographic groups most similar to Tohono O'odham are Lumbee (31.9%, a difference of 1.1%), Yuman (30.6%, a difference of 3.0%), Puerto Rican (32.8%, a difference of 4.1%), Navajo (30.3%, a difference of 4.2%), and Pima (29.7%, a difference of 6.1%).
| Demographics | Rating | Rank | Child Poverty Among Boys Under 16 |
| Apache | 0.0 /100 | #333 | Tragic 24.5% |
| Blacks/African Americans | 0.0 /100 | #334 | Tragic 24.5% |
| Yup'ik | 0.0 /100 | #335 | Tragic 24.7% |
| Sioux | 0.0 /100 | #336 | Tragic 25.3% |
| Cheyenne | 0.0 /100 | #337 | Tragic 25.8% |
| Hopi | 0.0 /100 | #338 | Tragic 25.9% |
| Houma | 0.0 /100 | #339 | Tragic 26.2% |
| Crow | 0.0 /100 | #340 | Tragic 26.3% |
| Immigrants | Yemen | 0.0 /100 | #341 | Tragic 28.9% |
| Pima | 0.0 /100 | #342 | Tragic 29.7% |
| Navajo | 0.0 /100 | #343 | Tragic 30.3% |
| Yuman | 0.0 /100 | #344 | Tragic 30.6% |
| Tohono O'odham | 0.0 /100 | #345 | Tragic 31.6% |
| Lumbee | 0.0 /100 | #346 | Tragic 31.9% |
| Puerto Ricans | 0.0 /100 | #347 | Tragic 32.8% |