Immigrants from Western Europe vs Jordanian Poverty
COMPARE
Immigrants from Western Europe
Jordanian
Poverty
Poverty Comparison
Immigrants from Western Europe
Jordanians
11.8%
POVERTY
85.2/ 100
METRIC RATING
133rd/ 347
METRIC RANK
11.4%
POVERTY
96.0/ 100
METRIC RATING
86th/ 347
METRIC RANK
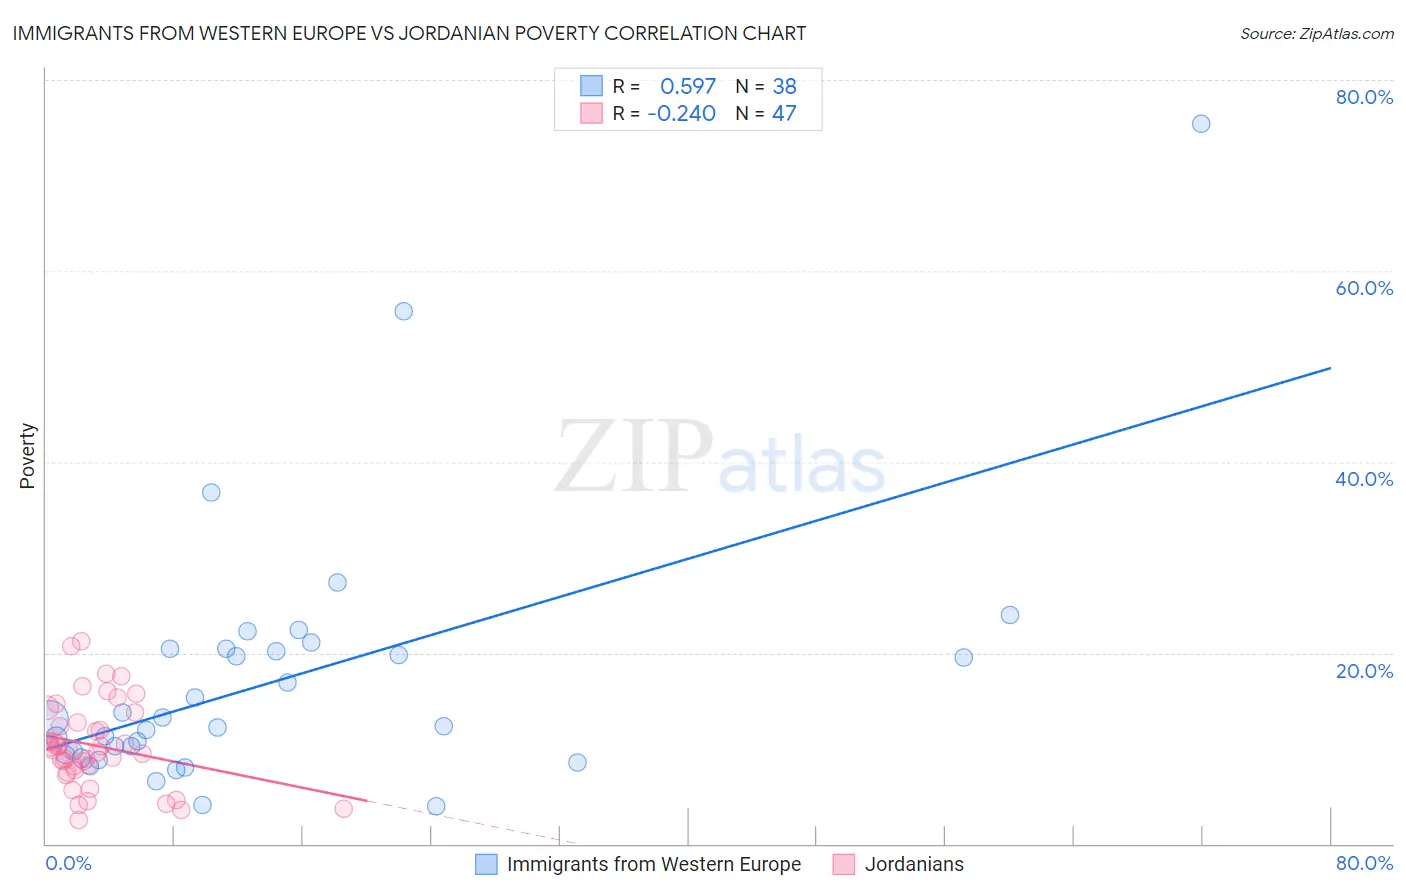
Immigrants from Western Europe vs Jordanian Poverty Correlation Chart
The statistical analysis conducted on geographies consisting of 493,769,922 people shows a substantial positive correlation between the proportion of Immigrants from Western Europe and poverty level in the United States with a correlation coefficient (R) of 0.597 and weighted average of 11.8%. Similarly, the statistical analysis conducted on geographies consisting of 166,402,418 people shows a weak negative correlation between the proportion of Jordanians and poverty level in the United States with a correlation coefficient (R) of -0.240 and weighted average of 11.4%, a difference of 3.7%.
Poverty Correlation Summary
| Measurement | Immigrants from Western Europe | Jordanian |
| Minimum | 3.9% | 2.5% |
| Maximum | 75.4% | 21.3% |
| Range | 71.5% | 18.7% |
| Mean | 17.1% | 10.3% |
| Median | 12.7% | 9.9% |
| Interquartile 25% (IQ1) | 9.3% | 7.7% |
| Interquartile 75% (IQ3) | 20.4% | 12.7% |
| Interquartile Range (IQR) | 11.1% | 5.0% |
| Standard Deviation (Sample) | 13.7% | 4.4% |
| Standard Deviation (Population) | 13.5% | 4.4% |
Similar Demographics by Poverty
Demographics Similar to Immigrants from Western Europe by Poverty
In terms of poverty, the demographic groups most similar to Immigrants from Western Europe are Yugoslavian (11.8%, a difference of 0.010%), Immigrants from Vietnam (11.8%, a difference of 0.020%), Peruvian (11.8%, a difference of 0.070%), French (11.8%, a difference of 0.19%), and Chilean (11.8%, a difference of 0.21%).
| Demographics | Rating | Rank | Poverty |
| Immigrants | Norway | 88.0 /100 | #126 | Excellent 11.7% |
| Immigrants | Argentina | 88.0 /100 | #127 | Excellent 11.7% |
| Immigrants | Israel | 87.4 /100 | #128 | Excellent 11.7% |
| South Africans | 87.0 /100 | #129 | Excellent 11.7% |
| Immigrants | Ukraine | 86.6 /100 | #130 | Excellent 11.8% |
| French | 86.1 /100 | #131 | Excellent 11.8% |
| Peruvians | 85.6 /100 | #132 | Excellent 11.8% |
| Immigrants | Western Europe | 85.2 /100 | #133 | Excellent 11.8% |
| Yugoslavians | 85.2 /100 | #134 | Excellent 11.8% |
| Immigrants | Vietnam | 85.2 /100 | #135 | Excellent 11.8% |
| Chileans | 84.2 /100 | #136 | Excellent 11.8% |
| Immigrants | Switzerland | 83.0 /100 | #137 | Excellent 11.8% |
| Immigrants | Jordan | 82.4 /100 | #138 | Excellent 11.9% |
| Pakistanis | 82.2 /100 | #139 | Excellent 11.9% |
| Immigrants | Peru | 81.1 /100 | #140 | Excellent 11.9% |
Demographics Similar to Jordanians by Poverty
In terms of poverty, the demographic groups most similar to Jordanians are Northern European (11.4%, a difference of 0.0%), Immigrants from England (11.4%, a difference of 0.12%), Belgian (11.4%, a difference of 0.14%), English (11.3%, a difference of 0.18%), and Czechoslovakian (11.4%, a difference of 0.18%).
| Demographics | Rating | Rank | Poverty |
| Cambodians | 96.7 /100 | #79 | Exceptional 11.3% |
| Indians (Asian) | 96.6 /100 | #80 | Exceptional 11.3% |
| Irish | 96.6 /100 | #81 | Exceptional 11.3% |
| Egyptians | 96.5 /100 | #82 | Exceptional 11.3% |
| Immigrants | Sweden | 96.3 /100 | #83 | Exceptional 11.3% |
| English | 96.3 /100 | #84 | Exceptional 11.3% |
| Immigrants | England | 96.2 /100 | #85 | Exceptional 11.4% |
| Jordanians | 96.0 /100 | #86 | Exceptional 11.4% |
| Northern Europeans | 96.0 /100 | #87 | Exceptional 11.4% |
| Belgians | 95.8 /100 | #88 | Exceptional 11.4% |
| Czechoslovakians | 95.7 /100 | #89 | Exceptional 11.4% |
| Immigrants | Denmark | 95.5 /100 | #90 | Exceptional 11.4% |
| Finns | 95.2 /100 | #91 | Exceptional 11.4% |
| British | 95.0 /100 | #92 | Exceptional 11.4% |
| Romanians | 94.9 /100 | #93 | Exceptional 11.4% |