Immigrants from Western Asia vs Yuman Single Father Poverty
COMPARE
Immigrants from Western Asia
Yuman
Single Father Poverty
Single Father Poverty Comparison
Immigrants from Western Asia
Yuman
16.0%
SINGLE FATHER POVERTY
80.7/ 100
METRIC RATING
145th/ 347
METRIC RANK
28.4%
SINGLE FATHER POVERTY
0.0/ 100
METRIC RATING
342nd/ 347
METRIC RANK
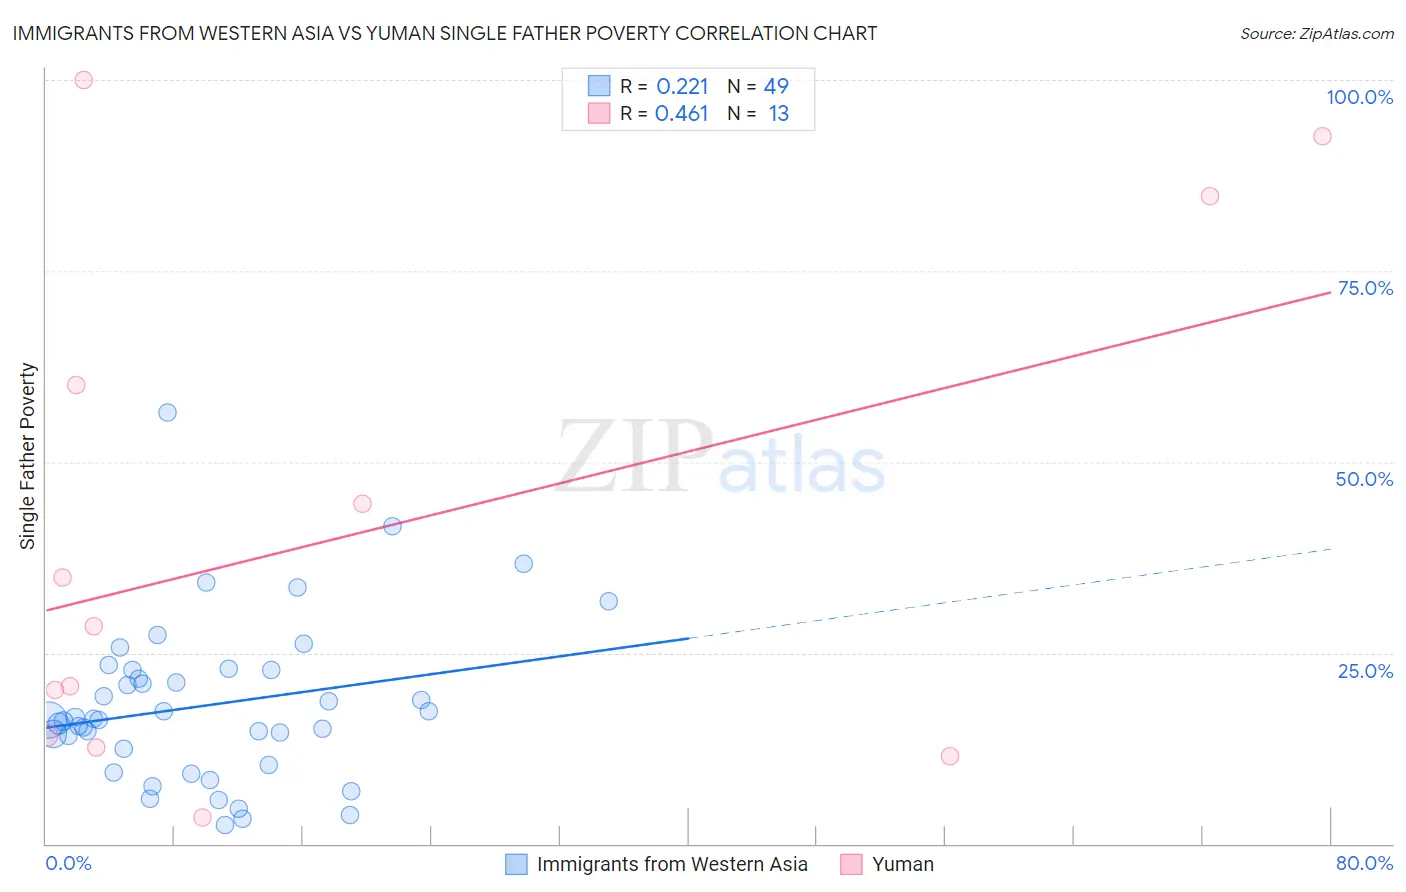
Immigrants from Western Asia vs Yuman Single Father Poverty Correlation Chart
The statistical analysis conducted on geographies consisting of 315,849,822 people shows a weak positive correlation between the proportion of Immigrants from Western Asia and poverty level among single fathers in the United States with a correlation coefficient (R) of 0.221 and weighted average of 16.0%. Similarly, the statistical analysis conducted on geographies consisting of 39,127,530 people shows a moderate positive correlation between the proportion of Yuman and poverty level among single fathers in the United States with a correlation coefficient (R) of 0.461 and weighted average of 28.4%, a difference of 77.0%.
Single Father Poverty Correlation Summary
| Measurement | Immigrants from Western Asia | Yuman |
| Minimum | 2.4% | 3.4% |
| Maximum | 56.5% | 100.0% |
| Range | 54.1% | 96.6% |
| Mean | 18.1% | 40.6% |
| Median | 16.3% | 28.5% |
| Interquartile 25% (IQ1) | 11.4% | 13.4% |
| Interquartile 75% (IQ3) | 22.7% | 72.4% |
| Interquartile Range (IQR) | 11.3% | 58.9% |
| Standard Deviation (Sample) | 10.5% | 33.3% |
| Standard Deviation (Population) | 10.3% | 32.0% |
Similar Demographics by Single Father Poverty
Demographics Similar to Immigrants from Western Asia by Single Father Poverty
In terms of single father poverty, the demographic groups most similar to Immigrants from Western Asia are Immigrants from Kuwait (16.0%, a difference of 0.050%), Immigrants from Hungary (16.1%, a difference of 0.16%), Immigrants from Central America (16.0%, a difference of 0.18%), Liberian (16.0%, a difference of 0.20%), and Immigrants from Mexico (16.0%, a difference of 0.20%).
| Demographics | Rating | Rank | Single Father Poverty |
| Central Americans | 87.1 /100 | #138 | Excellent 16.0% |
| South Americans | 85.9 /100 | #139 | Excellent 16.0% |
| Immigrants | Netherlands | 85.3 /100 | #140 | Excellent 16.0% |
| Liberians | 83.3 /100 | #141 | Excellent 16.0% |
| Immigrants | Mexico | 83.3 /100 | #142 | Excellent 16.0% |
| Immigrants | Central America | 83.1 /100 | #143 | Excellent 16.0% |
| Immigrants | Kuwait | 81.4 /100 | #144 | Excellent 16.0% |
| Immigrants | Western Asia | 80.7 /100 | #145 | Excellent 16.0% |
| Immigrants | Hungary | 78.3 /100 | #146 | Good 16.1% |
| Colombians | 77.1 /100 | #147 | Good 16.1% |
| Nigerians | 76.8 /100 | #148 | Good 16.1% |
| South Africans | 75.1 /100 | #149 | Good 16.1% |
| Jordanians | 74.2 /100 | #150 | Good 16.1% |
| Immigrants | France | 73.1 /100 | #151 | Good 16.1% |
| Immigrants | Zimbabwe | 72.1 /100 | #152 | Good 16.1% |
Demographics Similar to Yuman by Single Father Poverty
In terms of single father poverty, the demographic groups most similar to Yuman are Lumbee (28.5%, a difference of 0.33%), Navajo (29.2%, a difference of 2.9%), Hopi (27.2%, a difference of 4.5%), Houma (26.7%, a difference of 6.2%), and Crow (30.3%, a difference of 6.7%).
| Demographics | Rating | Rank | Single Father Poverty |
| Natives/Alaskans | 0.0 /100 | #333 | Tragic 22.4% |
| Kiowa | 0.0 /100 | #334 | Tragic 22.5% |
| Shoshone | 0.0 /100 | #335 | Tragic 22.9% |
| Cajuns | 0.0 /100 | #336 | Tragic 23.1% |
| Sioux | 0.0 /100 | #337 | Tragic 23.9% |
| Arapaho | 0.0 /100 | #338 | Tragic 24.0% |
| Apache | 0.0 /100 | #339 | Tragic 24.2% |
| Houma | 0.0 /100 | #340 | Tragic 26.7% |
| Hopi | 0.0 /100 | #341 | Tragic 27.2% |
| Yuman | 0.0 /100 | #342 | Tragic 28.4% |
| Lumbee | 0.0 /100 | #343 | Tragic 28.5% |
| Navajo | 0.0 /100 | #344 | Tragic 29.2% |
| Crow | 0.0 /100 | #345 | Tragic 30.3% |
| Puerto Ricans | 0.0 /100 | #346 | Tragic 31.5% |
| Yup'ik | 0.0 /100 | #347 | Tragic 32.5% |