Immigrants from Western Asia vs Guatemalan Male Poverty
COMPARE
Immigrants from Western Asia
Guatemalan
Male Poverty
Male Poverty Comparison
Immigrants from Western Asia
Guatemalans
11.8%
MALE POVERTY
9.8/ 100
METRIC RATING
203rd/ 347
METRIC RANK
13.8%
MALE POVERTY
0.0/ 100
METRIC RATING
289th/ 347
METRIC RANK
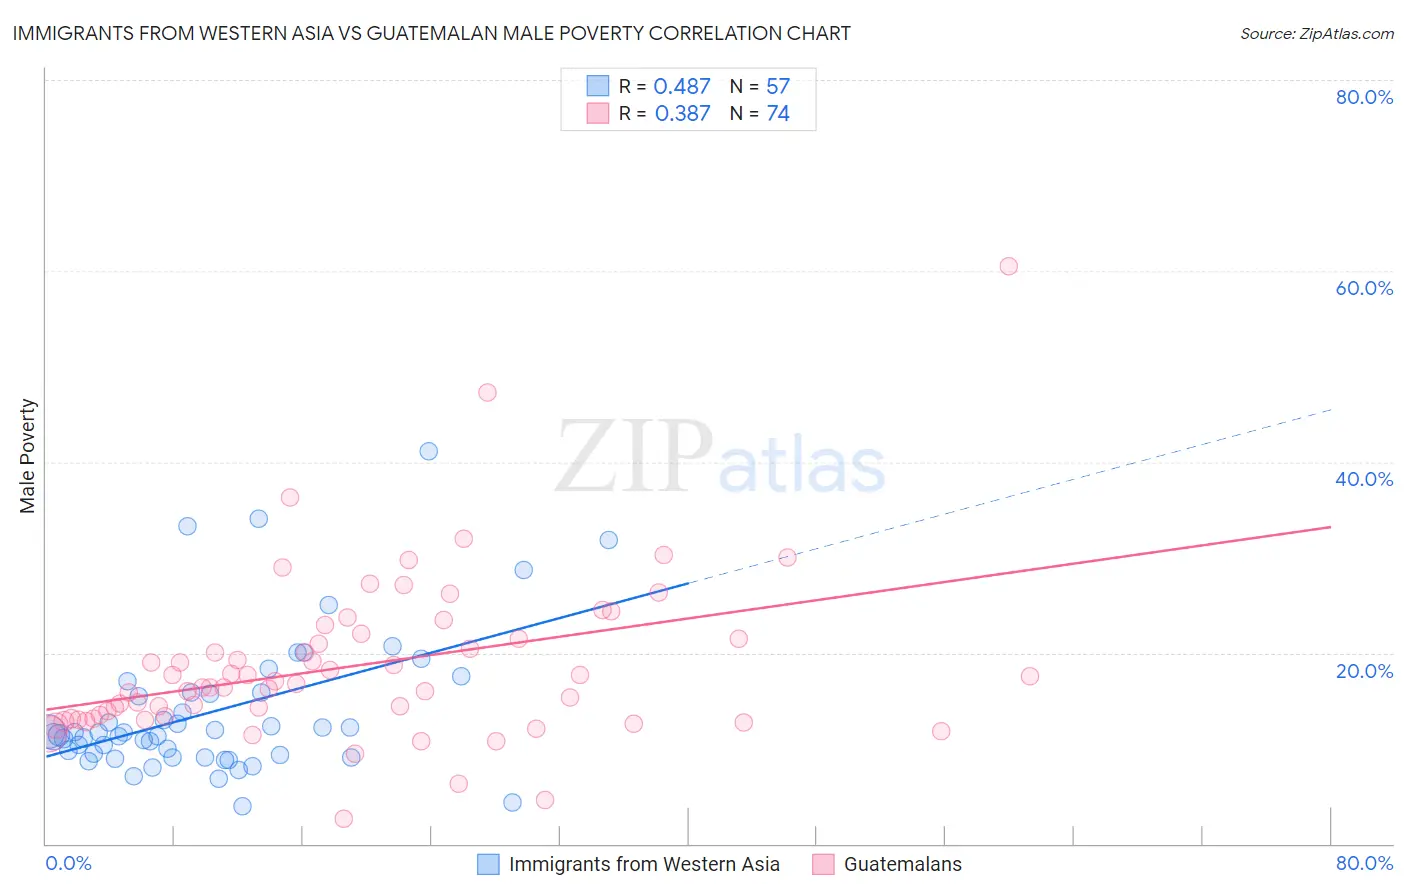
Immigrants from Western Asia vs Guatemalan Male Poverty Correlation Chart
The statistical analysis conducted on geographies consisting of 404,054,336 people shows a moderate positive correlation between the proportion of Immigrants from Western Asia and poverty level among males in the United States with a correlation coefficient (R) of 0.487 and weighted average of 11.8%. Similarly, the statistical analysis conducted on geographies consisting of 409,206,123 people shows a mild positive correlation between the proportion of Guatemalans and poverty level among males in the United States with a correlation coefficient (R) of 0.387 and weighted average of 13.8%, a difference of 17.1%.
Male Poverty Correlation Summary
| Measurement | Immigrants from Western Asia | Guatemalan |
| Minimum | 4.0% | 2.7% |
| Maximum | 41.1% | 60.5% |
| Range | 37.1% | 57.9% |
| Mean | 13.9% | 18.7% |
| Median | 11.7% | 16.6% |
| Interquartile 25% (IQ1) | 9.2% | 13.1% |
| Interquartile 75% (IQ3) | 15.9% | 21.5% |
| Interquartile Range (IQR) | 6.7% | 8.4% |
| Standard Deviation (Sample) | 7.5% | 8.7% |
| Standard Deviation (Population) | 7.4% | 8.7% |
Similar Demographics by Male Poverty
Demographics Similar to Immigrants from Western Asia by Male Poverty
In terms of male poverty, the demographic groups most similar to Immigrants from Western Asia are Aleut (11.8%, a difference of 0.14%), Immigrants from Uganda (11.8%, a difference of 0.36%), Spaniard (11.7%, a difference of 0.86%), Immigrants from Lebanon (11.7%, a difference of 0.87%), and Spanish (11.7%, a difference of 0.97%).
| Demographics | Rating | Rank | Male Poverty |
| Hmong | 15.8 /100 | #196 | Poor 11.6% |
| Delaware | 15.4 /100 | #197 | Poor 11.7% |
| Iraqis | 14.7 /100 | #198 | Poor 11.7% |
| Spanish | 14.1 /100 | #199 | Poor 11.7% |
| Immigrants | Lebanon | 13.6 /100 | #200 | Poor 11.7% |
| Spaniards | 13.5 /100 | #201 | Poor 11.7% |
| Aleuts | 10.4 /100 | #202 | Poor 11.8% |
| Immigrants | Western Asia | 9.8 /100 | #203 | Tragic 11.8% |
| Immigrants | Uganda | 8.5 /100 | #204 | Tragic 11.8% |
| Panamanians | 6.2 /100 | #205 | Tragic 11.9% |
| Immigrants | Eastern Africa | 5.4 /100 | #206 | Tragic 12.0% |
| Malaysians | 5.2 /100 | #207 | Tragic 12.0% |
| Immigrants | Immigrants | 4.5 /100 | #208 | Tragic 12.0% |
| Immigrants | Azores | 4.3 /100 | #209 | Tragic 12.0% |
| Moroccans | 4.2 /100 | #210 | Tragic 12.0% |
Demographics Similar to Guatemalans by Male Poverty
In terms of male poverty, the demographic groups most similar to Guatemalans are Immigrants from Zaire (13.8%, a difference of 0.010%), Vietnamese (13.8%, a difference of 0.10%), Immigrants from St. Vincent and the Grenadines (13.8%, a difference of 0.17%), Indonesian (13.8%, a difference of 0.26%), and Immigrants from Belize (13.8%, a difference of 0.27%).
| Demographics | Rating | Rank | Male Poverty |
| Immigrants | Cabo Verde | 0.0 /100 | #282 | Tragic 13.7% |
| Comanche | 0.0 /100 | #283 | Tragic 13.8% |
| Immigrants | Haiti | 0.0 /100 | #284 | Tragic 13.8% |
| West Indians | 0.0 /100 | #285 | Tragic 13.8% |
| Shoshone | 0.0 /100 | #286 | Tragic 13.8% |
| Immigrants | Barbados | 0.0 /100 | #287 | Tragic 13.8% |
| Immigrants | St. Vincent and the Grenadines | 0.0 /100 | #288 | Tragic 13.8% |
| Guatemalans | 0.0 /100 | #289 | Tragic 13.8% |
| Immigrants | Zaire | 0.0 /100 | #290 | Tragic 13.8% |
| Vietnamese | 0.0 /100 | #291 | Tragic 13.8% |
| Indonesians | 0.0 /100 | #292 | Tragic 13.8% |
| Immigrants | Belize | 0.0 /100 | #293 | Tragic 13.8% |
| Hispanics or Latinos | 0.0 /100 | #294 | Tragic 13.9% |
| Immigrants | Central America | 0.0 /100 | #295 | Tragic 13.9% |
| Cajuns | 0.0 /100 | #296 | Tragic 13.9% |