Immigrants from Western Africa vs Finnish Single Female Poverty
COMPARE
Immigrants from Western Africa
Finnish
Single Female Poverty
Single Female Poverty Comparison
Immigrants from Western Africa
Finns
22.0%
SINGLE FEMALE POVERTY
5.3/ 100
METRIC RATING
230th/ 347
METRIC RANK
21.5%
SINGLE FEMALE POVERTY
16.2/ 100
METRIC RATING
205th/ 347
METRIC RANK
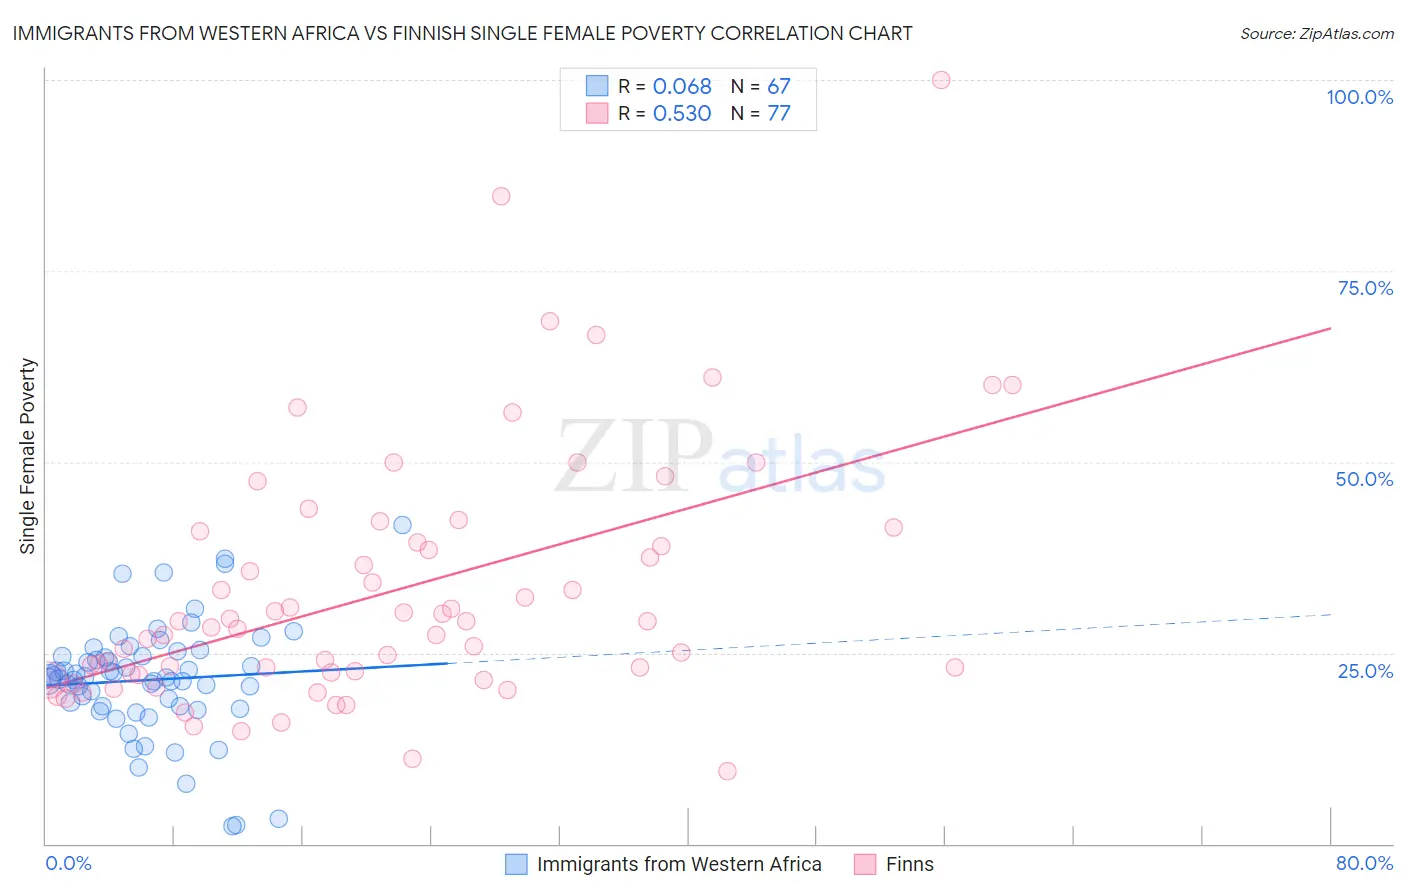
Immigrants from Western Africa vs Finnish Single Female Poverty Correlation Chart
The statistical analysis conducted on geographies consisting of 354,181,306 people shows a slight positive correlation between the proportion of Immigrants from Western Africa and poverty level among single females in the United States with a correlation coefficient (R) of 0.068 and weighted average of 22.0%. Similarly, the statistical analysis conducted on geographies consisting of 396,433,043 people shows a substantial positive correlation between the proportion of Finns and poverty level among single females in the United States with a correlation coefficient (R) of 0.530 and weighted average of 21.5%, a difference of 1.9%.
Single Female Poverty Correlation Summary
| Measurement | Immigrants from Western Africa | Finnish |
| Minimum | 2.3% | 9.5% |
| Maximum | 41.8% | 100.0% |
| Range | 39.5% | 90.5% |
| Mean | 21.4% | 33.0% |
| Median | 21.8% | 28.4% |
| Interquartile 25% (IQ1) | 18.0% | 22.2% |
| Interquartile 75% (IQ3) | 24.5% | 40.2% |
| Interquartile Range (IQR) | 6.6% | 18.0% |
| Standard Deviation (Sample) | 7.4% | 16.5% |
| Standard Deviation (Population) | 7.4% | 16.4% |
Similar Demographics by Single Female Poverty
Demographics Similar to Immigrants from Western Africa by Single Female Poverty
In terms of single female poverty, the demographic groups most similar to Immigrants from Western Africa are Tlingit-Haida (21.9%, a difference of 0.020%), Salvadoran (21.9%, a difference of 0.050%), Welsh (22.0%, a difference of 0.090%), Immigrants from Thailand (22.0%, a difference of 0.10%), and Immigrants from Ghana (21.9%, a difference of 0.14%).
| Demographics | Rating | Rank | Single Female Poverty |
| Scottish | 7.3 /100 | #223 | Tragic 21.8% |
| Barbadians | 7.2 /100 | #224 | Tragic 21.8% |
| English | 6.4 /100 | #225 | Tragic 21.9% |
| Immigrants | Portugal | 5.8 /100 | #226 | Tragic 21.9% |
| Immigrants | Ghana | 5.8 /100 | #227 | Tragic 21.9% |
| Salvadorans | 5.5 /100 | #228 | Tragic 21.9% |
| Tlingit-Haida | 5.4 /100 | #229 | Tragic 21.9% |
| Immigrants | Western Africa | 5.3 /100 | #230 | Tragic 22.0% |
| Welsh | 5.0 /100 | #231 | Tragic 22.0% |
| Immigrants | Thailand | 5.0 /100 | #232 | Tragic 22.0% |
| Spaniards | 4.7 /100 | #233 | Tragic 22.0% |
| Spanish | 4.7 /100 | #234 | Tragic 22.0% |
| Dutch | 4.6 /100 | #235 | Tragic 22.0% |
| Immigrants | Ecuador | 4.2 /100 | #236 | Tragic 22.0% |
| Vietnamese | 4.0 /100 | #237 | Tragic 22.0% |
Demographics Similar to Finns by Single Female Poverty
In terms of single female poverty, the demographic groups most similar to Finns are Belgian (21.5%, a difference of 0.020%), Ghanaian (21.6%, a difference of 0.050%), Immigrants from Africa (21.5%, a difference of 0.060%), Haitian (21.6%, a difference of 0.090%), and Immigrants from Eastern Africa (21.6%, a difference of 0.12%).
| Demographics | Rating | Rank | Single Female Poverty |
| Swiss | 24.2 /100 | #198 | Fair 21.4% |
| Immigrants | Immigrants | 22.0 /100 | #199 | Fair 21.4% |
| Irish | 21.4 /100 | #200 | Fair 21.4% |
| Nigerians | 20.9 /100 | #201 | Fair 21.4% |
| Immigrants | Kenya | 20.7 /100 | #202 | Fair 21.4% |
| Immigrants | Haiti | 18.8 /100 | #203 | Poor 21.5% |
| Immigrants | Africa | 16.7 /100 | #204 | Poor 21.5% |
| Finns | 16.2 /100 | #205 | Poor 21.5% |
| Belgians | 16.1 /100 | #206 | Poor 21.5% |
| Ghanaians | 15.7 /100 | #207 | Poor 21.6% |
| Haitians | 15.4 /100 | #208 | Poor 21.6% |
| Immigrants | Eastern Africa | 15.1 /100 | #209 | Poor 21.6% |
| Immigrants | Panama | 14.4 /100 | #210 | Poor 21.6% |
| Icelanders | 14.0 /100 | #211 | Poor 21.6% |
| Jamaicans | 14.0 /100 | #212 | Poor 21.6% |