Immigrants from West Indies vs U.S. Virgin Islander Female Poverty Among 18-24 Year Olds
COMPARE
Immigrants from West Indies
U.S. Virgin Islander
Female Poverty Among 18-24 Year Olds
Female Poverty Among 18-24 Year Olds Comparison
Immigrants from West Indies
U.S. Virgin Islanders
21.0%
FEMALE POVERTY AMONG 18-24 YEAR OLDS
2.2/ 100
METRIC RATING
250th/ 347
METRIC RANK
22.5%
FEMALE POVERTY AMONG 18-24 YEAR OLDS
0.0/ 100
METRIC RATING
293rd/ 347
METRIC RANK
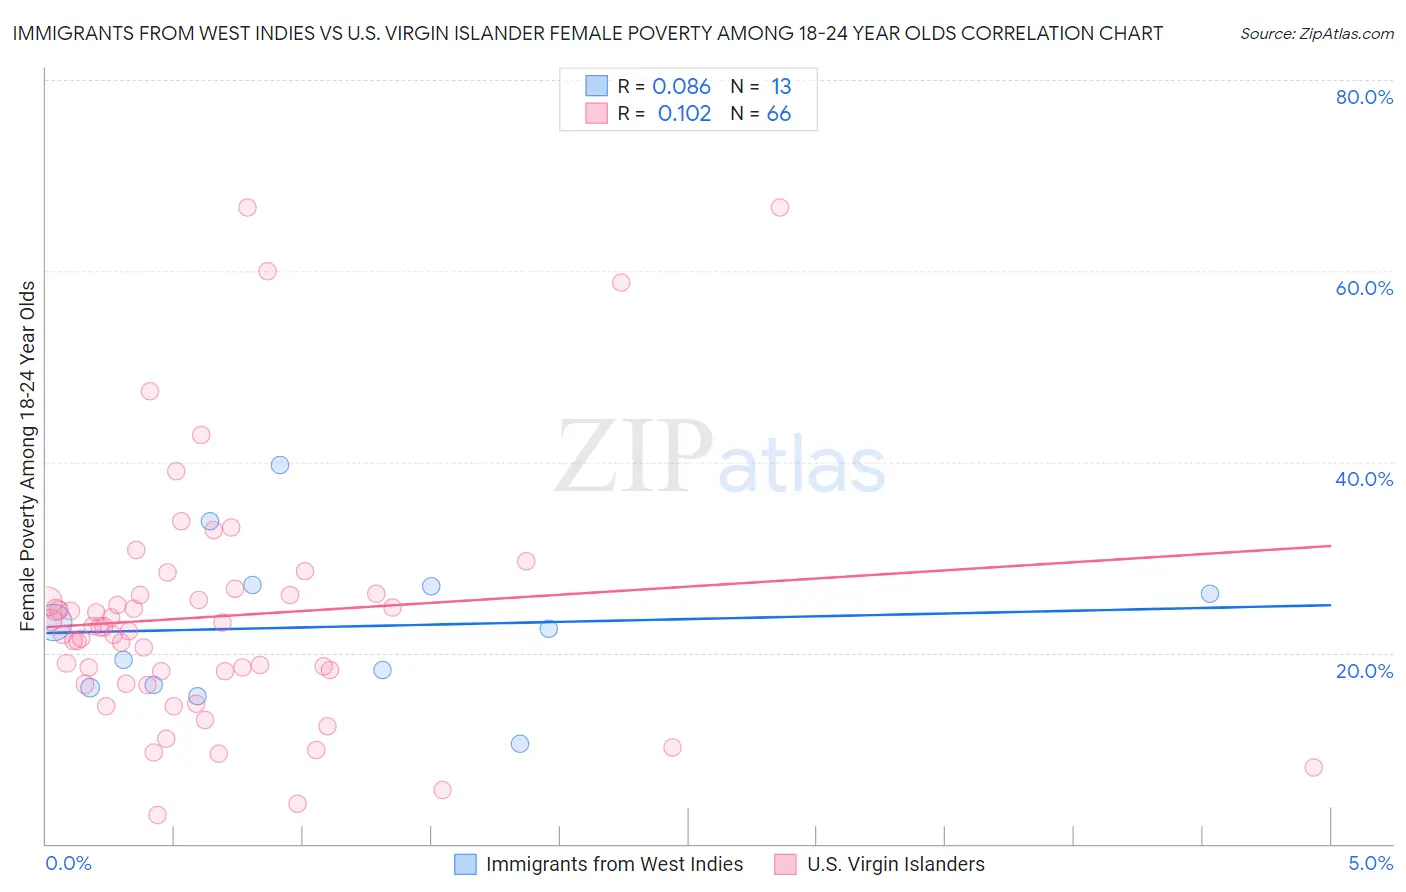
Immigrants from West Indies vs U.S. Virgin Islander Female Poverty Among 18-24 Year Olds Correlation Chart
The statistical analysis conducted on geographies consisting of 72,177,510 people shows a slight positive correlation between the proportion of Immigrants from West Indies and poverty level among females between the ages 18 and 24 in the United States with a correlation coefficient (R) of 0.086 and weighted average of 21.0%. Similarly, the statistical analysis conducted on geographies consisting of 87,095,394 people shows a poor positive correlation between the proportion of U.S. Virgin Islanders and poverty level among females between the ages 18 and 24 in the United States with a correlation coefficient (R) of 0.102 and weighted average of 22.5%, a difference of 6.9%.
Female Poverty Among 18-24 Year Olds Correlation Summary
| Measurement | Immigrants from West Indies | U.S. Virgin Islander |
| Minimum | 10.5% | 3.0% |
| Maximum | 39.6% | 66.7% |
| Range | 29.2% | 63.6% |
| Mean | 22.8% | 23.8% |
| Median | 22.6% | 22.5% |
| Interquartile 25% (IQ1) | 16.5% | 16.8% |
| Interquartile 75% (IQ3) | 27.1% | 26.1% |
| Interquartile Range (IQR) | 10.6% | 9.3% |
| Standard Deviation (Sample) | 8.0% | 13.1% |
| Standard Deviation (Population) | 7.7% | 13.0% |
Similar Demographics by Female Poverty Among 18-24 Year Olds
Demographics Similar to Immigrants from West Indies by Female Poverty Among 18-24 Year Olds
In terms of female poverty among 18-24 year olds, the demographic groups most similar to Immigrants from West Indies are Carpatho Rusyn (21.0%, a difference of 0.13%), Immigrants from Kenya (21.0%, a difference of 0.15%), West Indian (21.1%, a difference of 0.20%), Immigrants from Africa (21.0%, a difference of 0.35%), and South African (21.1%, a difference of 0.38%).
| Demographics | Rating | Rank | Female Poverty Among 18-24 Year Olds |
| Marshallese | 3.4 /100 | #243 | Tragic 20.9% |
| Immigrants | Thailand | 3.4 /100 | #244 | Tragic 20.9% |
| Aleuts | 3.3 /100 | #245 | Tragic 20.9% |
| Immigrants | Australia | 3.1 /100 | #246 | Tragic 20.9% |
| Immigrants | Africa | 3.0 /100 | #247 | Tragic 21.0% |
| Immigrants | Kenya | 2.5 /100 | #248 | Tragic 21.0% |
| Carpatho Rusyns | 2.5 /100 | #249 | Tragic 21.0% |
| Immigrants | West Indies | 2.2 /100 | #250 | Tragic 21.0% |
| West Indians | 1.9 /100 | #251 | Tragic 21.1% |
| South Africans | 1.6 /100 | #252 | Tragic 21.1% |
| Delaware | 1.6 /100 | #253 | Tragic 21.1% |
| British West Indians | 1.2 /100 | #254 | Tragic 21.2% |
| Immigrants | Grenada | 1.2 /100 | #255 | Tragic 21.2% |
| Tsimshian | 1.0 /100 | #256 | Tragic 21.2% |
| Taiwanese | 1.0 /100 | #257 | Tragic 21.2% |
Demographics Similar to U.S. Virgin Islanders by Female Poverty Among 18-24 Year Olds
In terms of female poverty among 18-24 year olds, the demographic groups most similar to U.S. Virgin Islanders are Alaskan Athabascan (22.5%, a difference of 0.030%), Indonesian (22.5%, a difference of 0.030%), Bangladeshi (22.5%, a difference of 0.080%), Shoshone (22.5%, a difference of 0.16%), and Menominee (22.5%, a difference of 0.26%).
| Demographics | Rating | Rank | Female Poverty Among 18-24 Year Olds |
| Ugandans | 0.0 /100 | #286 | Tragic 22.1% |
| Immigrants | Middle Africa | 0.0 /100 | #287 | Tragic 22.1% |
| Dominicans | 0.0 /100 | #288 | Tragic 22.3% |
| French American Indians | 0.0 /100 | #289 | Tragic 22.3% |
| Immigrants | Senegal | 0.0 /100 | #290 | Tragic 22.4% |
| Bangladeshis | 0.0 /100 | #291 | Tragic 22.5% |
| Alaskan Athabascans | 0.0 /100 | #292 | Tragic 22.5% |
| U.S. Virgin Islanders | 0.0 /100 | #293 | Tragic 22.5% |
| Indonesians | 0.0 /100 | #294 | Tragic 22.5% |
| Shoshone | 0.0 /100 | #295 | Tragic 22.5% |
| Menominee | 0.0 /100 | #296 | Tragic 22.5% |
| Inupiat | 0.0 /100 | #297 | Tragic 22.6% |
| Central American Indians | 0.0 /100 | #298 | Tragic 22.6% |
| Cherokee | 0.0 /100 | #299 | Tragic 22.7% |
| Africans | 0.0 /100 | #300 | Tragic 22.8% |