Immigrants from West Indies vs Immigrants from Morocco Poverty
COMPARE
Immigrants from West Indies
Immigrants from Morocco
Poverty
Poverty Comparison
Immigrants from West Indies
Immigrants from Morocco
14.8%
POVERTY
0.0/ 100
METRIC RATING
275th/ 347
METRIC RANK
12.4%
POVERTY
44.0/ 100
METRIC RATING
179th/ 347
METRIC RANK
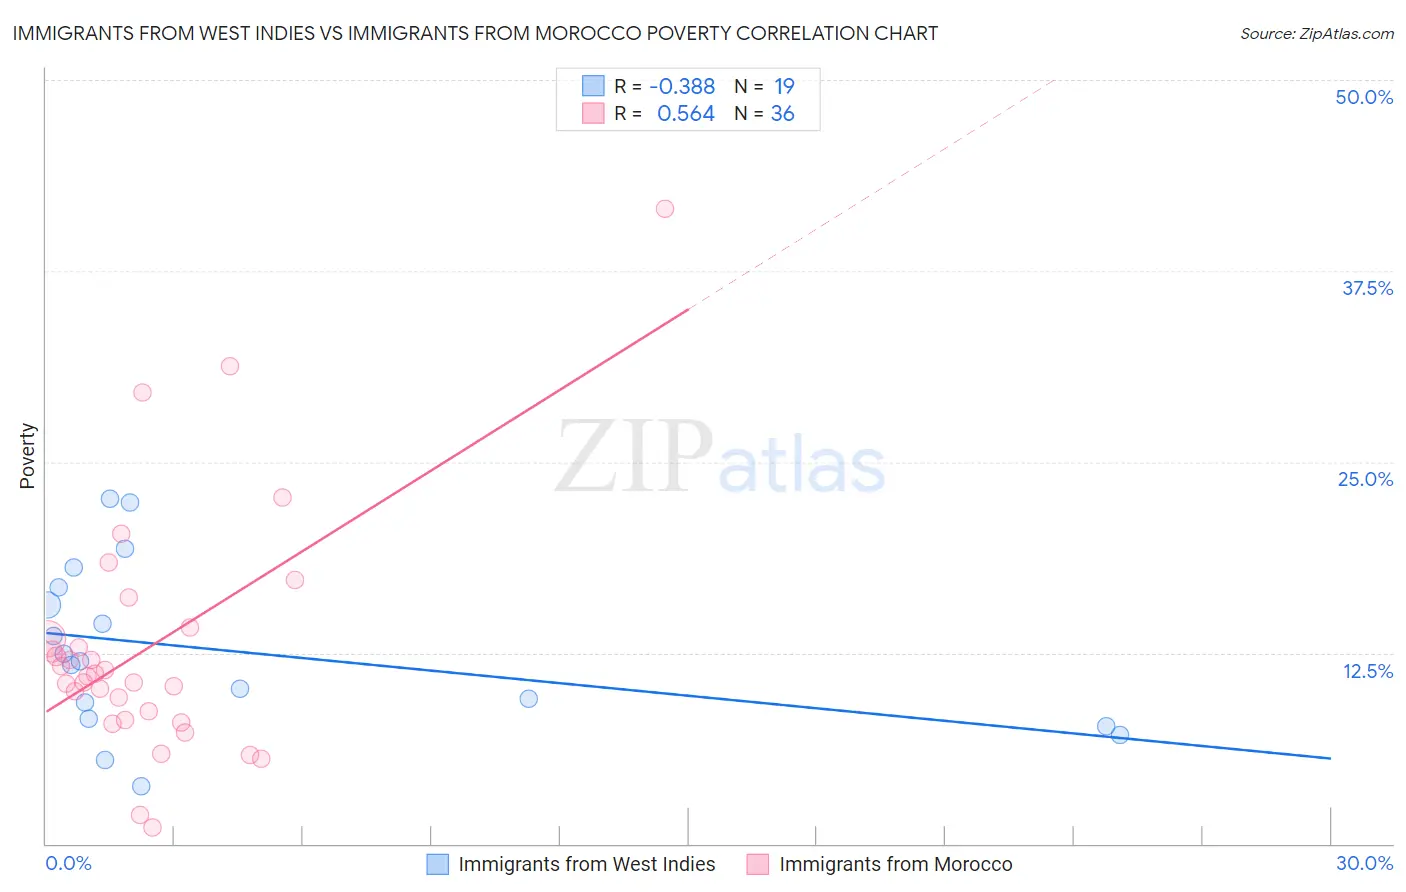
Immigrants from West Indies vs Immigrants from Morocco Poverty Correlation Chart
The statistical analysis conducted on geographies consisting of 72,454,628 people shows a mild negative correlation between the proportion of Immigrants from West Indies and poverty level in the United States with a correlation coefficient (R) of -0.388 and weighted average of 14.8%. Similarly, the statistical analysis conducted on geographies consisting of 178,904,952 people shows a substantial positive correlation between the proportion of Immigrants from Morocco and poverty level in the United States with a correlation coefficient (R) of 0.564 and weighted average of 12.4%, a difference of 19.5%.
Poverty Correlation Summary
| Measurement | Immigrants from West Indies | Immigrants from Morocco |
| Minimum | 3.7% | 1.1% |
| Maximum | 22.6% | 41.6% |
| Range | 18.9% | 40.5% |
| Mean | 12.6% | 12.9% |
| Median | 11.9% | 11.1% |
| Interquartile 25% (IQ1) | 8.2% | 8.4% |
| Interquartile 75% (IQ3) | 16.8% | 13.8% |
| Interquartile Range (IQR) | 8.6% | 5.4% |
| Standard Deviation (Sample) | 5.4% | 8.0% |
| Standard Deviation (Population) | 5.3% | 7.9% |
Similar Demographics by Poverty
Demographics Similar to Immigrants from West Indies by Poverty
In terms of poverty, the demographic groups most similar to Immigrants from West Indies are Immigrants from Bahamas (14.8%, a difference of 0.0%), Barbadian (14.8%, a difference of 0.040%), Bangladeshi (14.8%, a difference of 0.060%), Belizean (14.8%, a difference of 0.080%), and Immigrants from St. Vincent and the Grenadines (14.9%, a difference of 0.37%).
| Demographics | Rating | Rank | Poverty |
| Sub-Saharan Africans | 0.1 /100 | #268 | Tragic 14.5% |
| Immigrants | Cuba | 0.1 /100 | #269 | Tragic 14.6% |
| Central Americans | 0.1 /100 | #270 | Tragic 14.6% |
| Shoshone | 0.0 /100 | #271 | Tragic 14.7% |
| Chickasaw | 0.0 /100 | #272 | Tragic 14.7% |
| Spanish Americans | 0.0 /100 | #273 | Tragic 14.7% |
| Barbadians | 0.0 /100 | #274 | Tragic 14.8% |
| Immigrants | West Indies | 0.0 /100 | #275 | Tragic 14.8% |
| Immigrants | Bahamas | 0.0 /100 | #276 | Tragic 14.8% |
| Bangladeshis | 0.0 /100 | #277 | Tragic 14.8% |
| Belizeans | 0.0 /100 | #278 | Tragic 14.8% |
| Immigrants | St. Vincent and the Grenadines | 0.0 /100 | #279 | Tragic 14.9% |
| Haitians | 0.0 /100 | #280 | Tragic 14.9% |
| Immigrants | Barbados | 0.0 /100 | #281 | Tragic 14.9% |
| Comanche | 0.0 /100 | #282 | Tragic 15.0% |
Demographics Similar to Immigrants from Morocco by Poverty
In terms of poverty, the demographic groups most similar to Immigrants from Morocco are Mongolian (12.4%, a difference of 0.040%), Uruguayan (12.4%, a difference of 0.060%), Immigrants from Afghanistan (12.4%, a difference of 0.19%), Immigrants from Cameroon (12.4%, a difference of 0.23%), and Immigrants from Syria (12.3%, a difference of 0.33%).
| Demographics | Rating | Rank | Poverty |
| Immigrants | Portugal | 50.5 /100 | #172 | Average 12.3% |
| Celtics | 50.1 /100 | #173 | Average 12.3% |
| Lebanese | 50.0 /100 | #174 | Average 12.3% |
| South Americans | 48.7 /100 | #175 | Average 12.3% |
| Immigrants | Colombia | 47.7 /100 | #176 | Average 12.3% |
| Immigrants | Syria | 47.5 /100 | #177 | Average 12.3% |
| Uruguayans | 44.7 /100 | #178 | Average 12.4% |
| Immigrants | Morocco | 44.0 /100 | #179 | Average 12.4% |
| Mongolians | 43.6 /100 | #180 | Average 12.4% |
| Immigrants | Afghanistan | 42.1 /100 | #181 | Average 12.4% |
| Immigrants | Cameroon | 41.7 /100 | #182 | Average 12.4% |
| Immigrants | Iraq | 40.2 /100 | #183 | Average 12.4% |
| Kenyans | 38.8 /100 | #184 | Fair 12.5% |
| Israelis | 36.4 /100 | #185 | Fair 12.5% |
| Immigrants | Sierra Leone | 36.3 /100 | #186 | Fair 12.5% |