Immigrants from Vietnam vs Immigrants from El Salvador Single Mother Poverty

COMPARE

Immigrants from Vietnam
Race
Ancestry
AfghanAfricanAlaska NativeAlaskan AthabascanAlbanianAleutAlsatianAmericanApacheArabArapahoArgentineanArmenianAssyrian/Chaldean/SyriacAustralianAustrianBahamianBangladeshiBarbadianBasqueBelgianBelizeanBermudanBhutaneseBlackfeetBolivianBrazilianBritishBritish West IndianBulgarianBurmeseCajunCambodianCanadianCape VerdeanCarpatho RusynCelticCentral AmericanCentral American IndianCherokeeCheyenneChickasawChileanChineseChippewaChoctawColombianColvilleComancheCosta RicanCreeCreekCroatianCrowCubanCypriotCzechCzechoslovakianDanishDelawareDominicanDutchDutch West IndianEastern EuropeanEcuadorianEgyptianEnglishEstonianEthiopianEuropeanFijianFilipinoFinnishFrenchFrench American IndianFrench CanadianGermanGerman RussianGhanaianGreekGuamanian/ChamorroGuatemalanGuyaneseHaitianHmongHonduranHopiHoumaHungarianIcelanderIndian (Asian)IndonesianInupiatIranianIraqiIrishIroquoisIsraeliItalianJamaicanJapaneseJordanianKenyanKiowaKoreanLaotianLatvianLebaneseLiberianLithuanianLumbeeLuxembourgerMacedonianMalaysianMalteseMarshalleseMenomineeMexicanMexican American IndianMongolianMoroccanNative HawaiianNavajoNepaleseNew ZealanderNicaraguanNigerianNorthern EuropeanNorwegianOkinawanOsageOttawaPaiutePakistaniPalestinianPanamanianParaguayanPennsylvania GermanPeruvianPimaPolishPortuguesePotawatomiPuebloPuerto RicanPuget Sound SalishRomanianRussianSalvadoranSamoanScandinavianScotch-IrishScottishSeminoleSenegaleseSerbianShoshoneSierra LeoneanSiouxSlavicSlovakSloveneSomaliSouth AfricanSouth AmericanSouth American IndianSoviet UnionSpaniardSpanishSpanish AmericanSpanish American IndianSri LankanSubsaharan AfricanSudaneseSwedishSwissSyrianTaiwaneseThaiTlingit-HaidaTohono O'OdhamTonganTrinidadian and TobagonianTsimshianTurkishU.S. Virgin IslanderUgandanUkrainianUruguayanUteVenezuelanVietnameseWelshWest IndianYakamaYaquiYugoslavianYumanYup'ikZimbabwean
Immigration
NonimmigrantsImmigrantsAfghanistanAfricaAlbaniaArgentinaArmeniaAsiaAustraliaAustriaBahamasBangladeshBarbadosBelarusBelgiumBelizeBoliviaBosnia and HerzegovinaBrazilBulgariaBurma/MyanmarCabo VerdeCambodiaCameroonCanadaCaribbeanCentral AmericaChileChinaColombiaCongoCosta RicaCroatiaCubaCzechoslovakiaDenmarkDominicaDominican RepublicEastern AfricaEastern AsiaEastern EuropeEcuadorEgyptEnglandEritreaEthiopiaEuropeFijiFranceGermanyGhanaGreeceGrenadaGuatemalaGuyanaHaitiHondurasHong KongHungaryIndiaIndonesiaIranIraqIrelandIsraelItalyJamaicaJapanJordanKazakhstanKenyaKoreaKuwaitLaosLatin AmericaLatviaLebanonLiberiaLithuaniaMalaysiaMexicoMicronesiaMiddle AfricaMoldovaMoroccoNepalNetherlandsNicaraguaNigeriaNorth AmericaNorth MacedoniaNorthern AfricaNorthern EuropeNorwayOceaniaPakistanPanamaPeruPhilippinesPolandPortugalRomaniaRussiaSaudi ArabiaScotlandSenegalSerbiaSierra LeoneSingaporeSomaliaSouth AfricaSouth AmericaSouth Central AsiaSouth Eastern AsiaSouthern EuropeSpainSri LankaSt. Vincent and the GrenadinesSudanSwedenSwitzerlandSyriaTaiwanThailandTrinidad and TobagoTurkeyUgandaUkraineUruguayUzbekistanVenezuelaVietnamWest IndiesWestern AfricaWestern AsiaWestern EuropeYemenZaireZimbabweAzores
Immigrants from El Salvador
Race
Ancestry
AfghanAfricanAlaska NativeAlaskan AthabascanAlbanianAleutAlsatianAmericanApacheArabArapahoArgentineanArmenianAssyrian/Chaldean/SyriacAustralianAustrianBahamianBangladeshiBarbadianBasqueBelgianBelizeanBermudanBhutaneseBlackfeetBolivianBrazilianBritishBritish West IndianBulgarianBurmeseCajunCambodianCanadianCape VerdeanCarpatho RusynCelticCentral AmericanCentral American IndianCherokeeCheyenneChickasawChileanChineseChippewaChoctawColombianColvilleComancheCosta RicanCreeCreekCroatianCrowCubanCypriotCzechCzechoslovakianDanishDelawareDominicanDutchDutch West IndianEastern EuropeanEcuadorianEgyptianEnglishEstonianEthiopianEuropeanFijianFilipinoFinnishFrenchFrench American IndianFrench CanadianGermanGerman RussianGhanaianGreekGuamanian/ChamorroGuatemalanGuyaneseHaitianHmongHonduranHopiHoumaHungarianIcelanderIndian (Asian)IndonesianInupiatIranianIraqiIrishIroquoisIsraeliItalianJamaicanJapaneseJordanianKenyanKiowaKoreanLaotianLatvianLebaneseLiberianLithuanianLumbeeLuxembourgerMacedonianMalaysianMalteseMarshalleseMenomineeMexicanMexican American IndianMongolianMoroccanNative HawaiianNavajoNepaleseNew ZealanderNicaraguanNigerianNorthern EuropeanNorwegianOkinawanOsageOttawaPaiutePakistaniPalestinianPanamanianParaguayanPennsylvania GermanPeruvianPimaPolishPortuguesePotawatomiPuebloPuerto RicanPuget Sound SalishRomanianRussianSalvadoranSamoanScandinavianScotch-IrishScottishSeminoleSenegaleseSerbianShoshoneSierra LeoneanSiouxSlavicSlovakSloveneSomaliSouth AfricanSouth AmericanSouth American IndianSoviet UnionSpaniardSpanishSpanish AmericanSpanish American IndianSri LankanSubsaharan AfricanSudaneseSwedishSwissSyrianTaiwaneseThaiTlingit-HaidaTohono O'OdhamTonganTrinidadian and TobagonianTsimshianTurkishU.S. Virgin IslanderUgandanUkrainianUruguayanUteVenezuelanVietnameseWelshWest IndianYakamaYaquiYugoslavianYumanYup'ikZimbabwean
Immigration
NonimmigrantsImmigrantsAfghanistanAfricaAlbaniaArgentinaArmeniaAsiaAustraliaAustriaBahamasBangladeshBarbadosBelarusBelgiumBelizeBoliviaBosnia and HerzegovinaBrazilBulgariaBurma/MyanmarCabo VerdeCambodiaCameroonCanadaCaribbeanCentral AmericaChileChinaColombiaCongoCosta RicaCroatiaCubaCzechoslovakiaDenmarkDominicaDominican RepublicEastern AfricaEastern AsiaEastern EuropeEcuadorEgyptEl SalvadorEnglandEritreaEthiopiaEuropeFijiFranceGermanyGhanaGreeceGrenadaGuatemalaGuyanaHaitiHondurasHong KongHungaryIndiaIndonesiaIranIraqIrelandIsraelItalyJamaicaJapanJordanKazakhstanKenyaKoreaKuwaitLaosLatin AmericaLatviaLebanonLiberiaLithuaniaMalaysiaMexicoMicronesiaMiddle AfricaMoldovaMoroccoNepalNetherlandsNicaraguaNigeriaNorth AmericaNorth MacedoniaNorthern AfricaNorthern EuropeNorwayOceaniaPakistanPanamaPeruPhilippinesPolandPortugalRomaniaRussiaSaudi ArabiaScotlandSenegalSerbiaSierra LeoneSingaporeSomaliaSouth AfricaSouth AmericaSouth Central AsiaSouth Eastern AsiaSouthern EuropeSpainSri LankaSt. Vincent and the GrenadinesSudanSwedenSwitzerlandSyriaTaiwanThailandTrinidad and TobagoTurkeyUgandaUkraineUruguayUzbekistanVenezuelaWest IndiesWestern AfricaWestern AsiaWestern EuropeYemenZaireZimbabweAzores
Single Mother Poverty
Income
Poverty
Unemployment
Labor Participation
Family Structure
Vehicle Availability
Education Level
Disability

Single Mother Poverty Comparison

Immigrants from Vietnam

Immigrants from El Salvador

Exceptional
Tragic
26.7%
SINGLE MOTHER POVERTY
99.9/ 100
METRIC RATING
40th/ 347
METRIC RANK
31.2%
SINGLE MOTHER POVERTY
0.3/ 100
METRIC RATING
261st/ 347
METRIC RANK

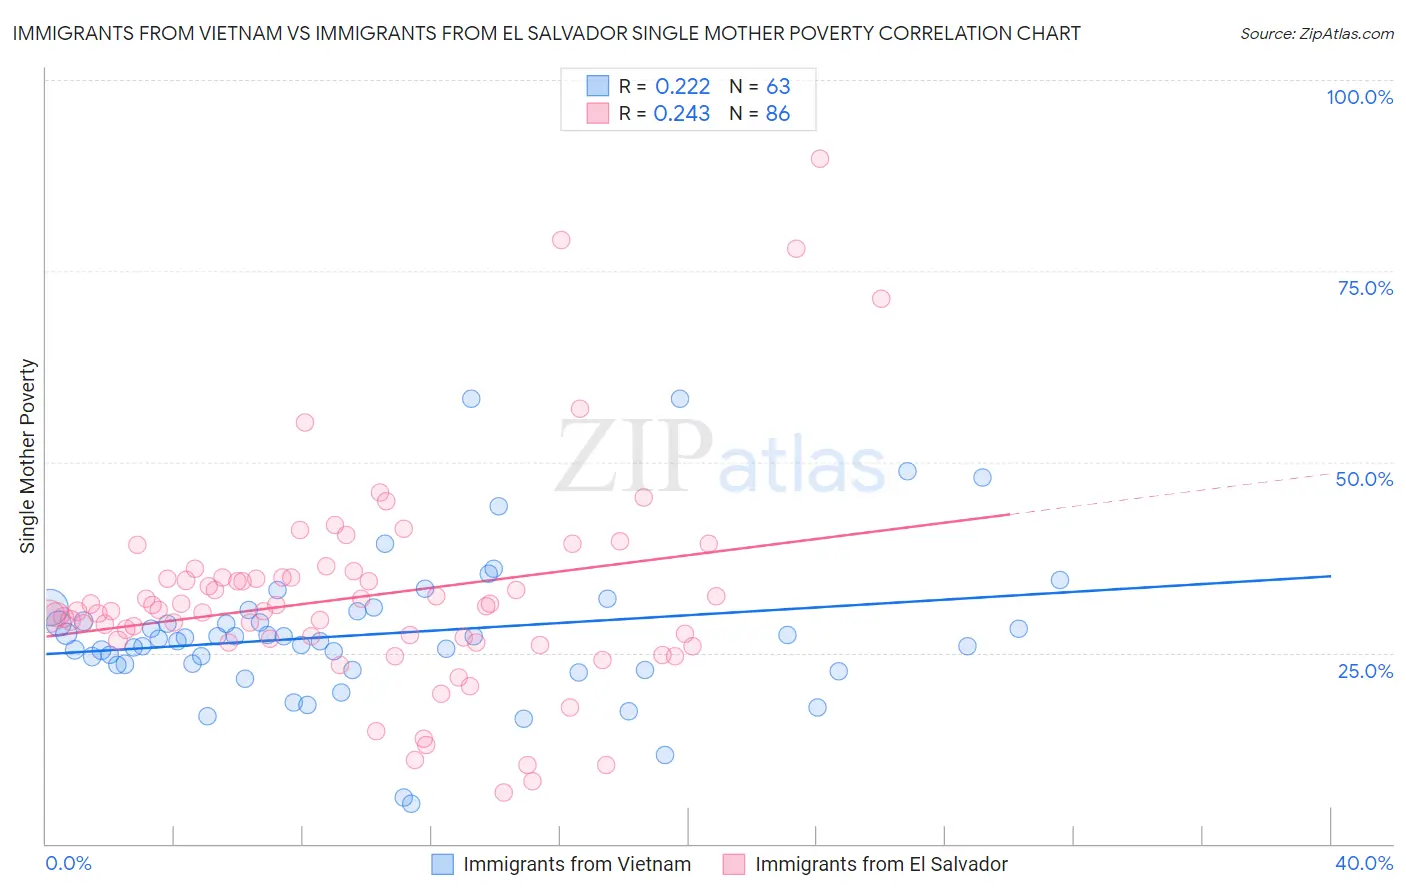
Immigrants from Vietnam vs Immigrants from El Salvador Single Mother Poverty Correlation Chart

The statistical analysis conducted on geographies consisting of 395,889,190 people shows a weak positive correlation between the proportion of Immigrants from Vietnam and poverty level among single mothers in the United States with a correlation coefficient (R) of 0.222 and weighted average of 26.7%. Similarly, the statistical analysis conducted on geographies consisting of 352,610,814 people shows a weak positive correlation between the proportion of Immigrants from El Salvador and poverty level among single mothers in the United States with a correlation coefficient (R) of 0.243 and weighted average of 31.2%, a difference of 16.8%.
Immigrants from Vietnam vs Immigrants from El Salvador Single Mother Poverty

Single Mother Poverty Correlation Summary

MeasurementImmigrants from VietnamImmigrants from El Salvador
Minimum5.2%6.7%
Maximum58.3%89.6%
Range53.1%83.0%
Mean27.5%32.4%
Median26.8%30.6%
Interquartile 25% (IQ1)23.5%26.6%
Interquartile 75% (IQ3)30.5%34.8%
Interquartile Range (IQR)7.0%8.2%
Standard Deviation (Sample)9.5%13.9%
Standard Deviation (Population)9.4%13.8%

Similar Demographics by Single Mother Poverty

Demographics Similar to Immigrants from Vietnam by Single Mother Poverty

In terms of single mother poverty, the demographic groups most similar to Immigrants from Vietnam are Immigrants from Greece (26.7%, a difference of 0.070%), Sri Lankan (26.7%, a difference of 0.090%), Armenian (26.8%, a difference of 0.31%), Tsimshian (26.8%, a difference of 0.39%), and Immigrants from Fiji (26.6%, a difference of 0.43%).
DemographicsRating | RankSingle Mother Poverty
Bulgarians
99.9
/100
|
#33
Exceptional
26.5%
Immigrants | Indonesia
99.9
/100
|
#34
Exceptional
26.6%
Maltese
99.9
/100
|
#35
Exceptional
26.6%
Okinawans
99.9
/100
|
#36
Exceptional
26.6%
Immigrants | Israel
99.9
/100
|
#37
Exceptional
26.6%
Immigrants | Fiji
99.9
/100
|
#38
Exceptional
26.6%
Sri Lankans
99.9
/100
|
#39
Exceptional
26.7%
Immigrants | Vietnam
99.9
/100
|
#40
Exceptional
26.7%
Immigrants | Greece
99.9
/100
|
#41
Exceptional
26.7%
Armenians
99.9
/100
|
#42
Exceptional
26.8%
Tsimshian
99.9
/100
|
#43
Exceptional
26.8%
Immigrants | Sierra Leone
99.9
/100
|
#44
Exceptional
26.9%
Latvians
99.9
/100
|
#45
Exceptional
26.9%
Immigrants | Serbia
99.9
/100
|
#46
Exceptional
26.9%
Egyptians
99.8
/100
|
#47
Exceptional
26.9%

Demographics Similar to Immigrants from El Salvador by Single Mother Poverty

In terms of single mother poverty, the demographic groups most similar to Immigrants from El Salvador are White/Caucasian (31.2%, a difference of 0.080%), Hmong (31.2%, a difference of 0.14%), Immigrants from Bangladesh (31.1%, a difference of 0.23%), Immigrants from Caribbean (31.1%, a difference of 0.27%), and Immigrants from Bahamas (31.1%, a difference of 0.35%).
DemographicsRating | RankSingle Mother Poverty
Senegalese
0.5
/100
|
#254
Tragic
31.0%
Belizeans
0.5
/100
|
#255
Tragic
31.0%
Immigrants | West Indies
0.4
/100
|
#256
Tragic
31.1%
Immigrants | Bahamas
0.4
/100
|
#257
Tragic
31.1%
Immigrants | Caribbean
0.4
/100
|
#258
Tragic
31.1%
Immigrants | Bangladesh
0.4
/100
|
#259
Tragic
31.1%
Whites/Caucasians
0.3
/100
|
#260
Tragic
31.2%
Immigrants | El Salvador
0.3
/100
|
#261
Tragic
31.2%
Hmong
0.3
/100
|
#262
Tragic
31.2%
Bahamians
0.2
/100
|
#263
Tragic
31.3%
Immigrants | Ecuador
0.2
/100
|
#264
Tragic
31.3%
German Russians
0.2
/100
|
#265
Tragic
31.3%
Sub-Saharan Africans
0.2
/100
|
#266
Tragic
31.4%
Immigrants | Belize
0.2
/100
|
#267
Tragic
31.4%
Immigrants | Senegal
0.1
/100
|
#268
Tragic
31.5%