Immigrants from Venezuela vs Sri Lankan Female Poverty Among 25-34 Year Olds
COMPARE
Immigrants from Venezuela
Sri Lankan
Female Poverty Among 25-34 Year Olds
Female Poverty Among 25-34 Year Olds Comparison
Immigrants from Venezuela
Sri Lankans
13.6%
FEMALE POVERTY AMONG 25-34 YEAR OLDS
40.7/ 100
METRIC RATING
182nd/ 347
METRIC RANK
12.2%
FEMALE POVERTY AMONG 25-34 YEAR OLDS
99.1/ 100
METRIC RATING
68th/ 347
METRIC RANK
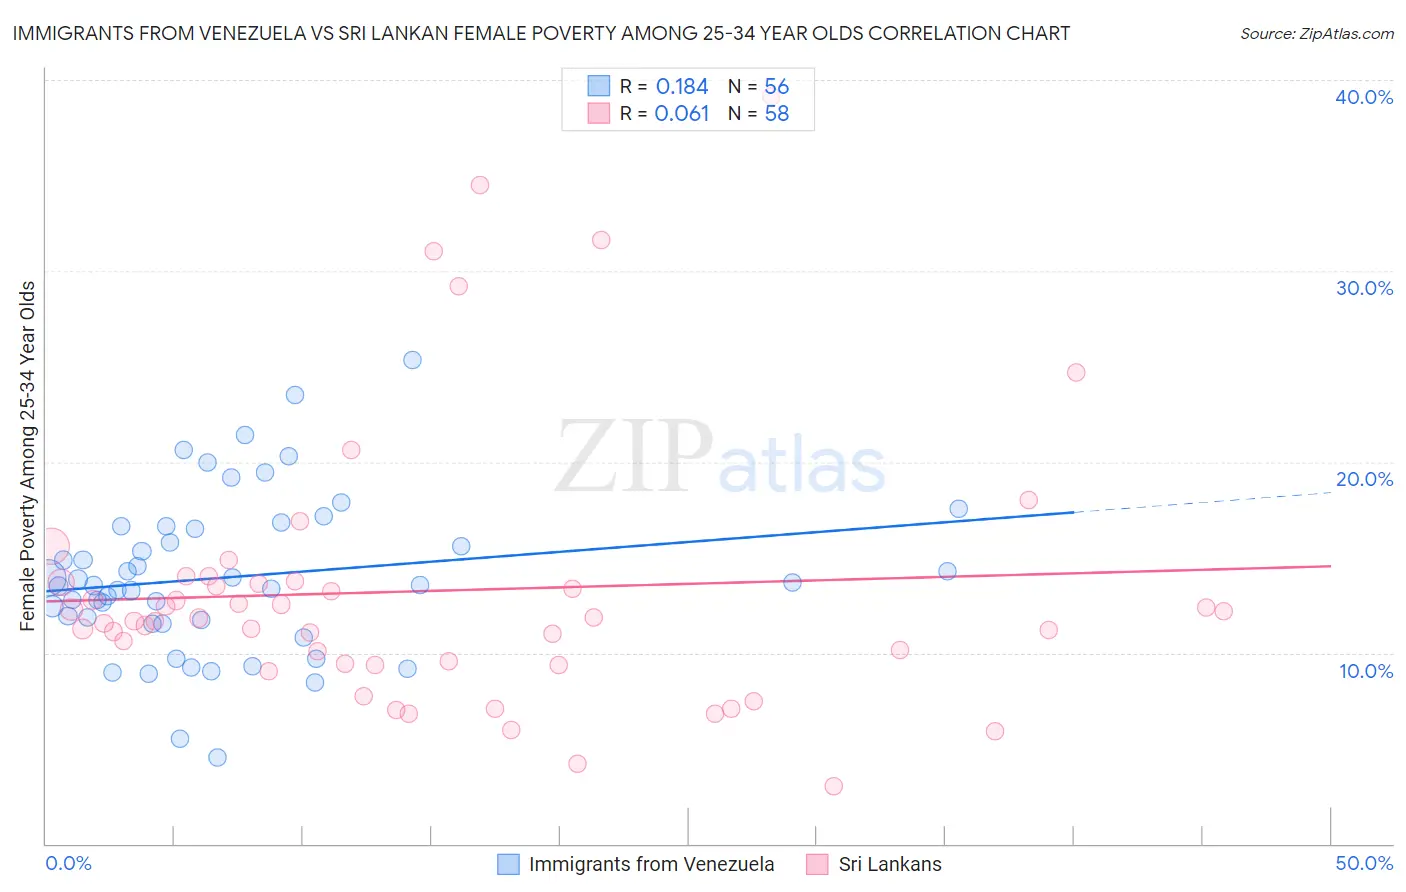
Immigrants from Venezuela vs Sri Lankan Female Poverty Among 25-34 Year Olds Correlation Chart
The statistical analysis conducted on geographies consisting of 285,242,429 people shows a poor positive correlation between the proportion of Immigrants from Venezuela and poverty level among females between the ages 25 and 34 in the United States with a correlation coefficient (R) of 0.184 and weighted average of 13.6%. Similarly, the statistical analysis conducted on geographies consisting of 433,227,670 people shows a slight positive correlation between the proportion of Sri Lankans and poverty level among females between the ages 25 and 34 in the United States with a correlation coefficient (R) of 0.061 and weighted average of 12.2%, a difference of 11.7%.
Female Poverty Among 25-34 Year Olds Correlation Summary
| Measurement | Immigrants from Venezuela | Sri Lankan |
| Minimum | 4.5% | 3.0% |
| Maximum | 25.3% | 39.1% |
| Range | 20.8% | 36.1% |
| Mean | 14.0% | 13.2% |
| Median | 13.5% | 11.8% |
| Interquartile 25% (IQ1) | 11.6% | 9.4% |
| Interquartile 75% (IQ3) | 16.6% | 13.7% |
| Interquartile Range (IQR) | 4.9% | 4.2% |
| Standard Deviation (Sample) | 4.2% | 7.2% |
| Standard Deviation (Population) | 4.1% | 7.2% |
Similar Demographics by Female Poverty Among 25-34 Year Olds
Demographics Similar to Immigrants from Venezuela by Female Poverty Among 25-34 Year Olds
In terms of female poverty among 25-34 year olds, the demographic groups most similar to Immigrants from Venezuela are Portuguese (13.6%, a difference of 0.030%), German (13.6%, a difference of 0.070%), Guamanian/Chamorro (13.6%, a difference of 0.070%), Immigrants from Eastern Africa (13.6%, a difference of 0.24%), and Canadian (13.6%, a difference of 0.30%).
| Demographics | Rating | Rank | Female Poverty Among 25-34 Year Olds |
| Bermudans | 46.8 /100 | #175 | Average 13.6% |
| Yugoslavians | 45.0 /100 | #176 | Average 13.6% |
| Venezuelans | 44.6 /100 | #177 | Average 13.6% |
| Canadians | 44.3 /100 | #178 | Average 13.6% |
| Immigrants | Eastern Africa | 43.6 /100 | #179 | Average 13.6% |
| Germans | 41.6 /100 | #180 | Average 13.6% |
| Guamanians/Chamorros | 41.5 /100 | #181 | Average 13.6% |
| Immigrants | Venezuela | 40.7 /100 | #182 | Average 13.6% |
| Portuguese | 40.3 /100 | #183 | Average 13.6% |
| Czechoslovakians | 36.8 /100 | #184 | Fair 13.7% |
| Irish | 35.3 /100 | #185 | Fair 13.7% |
| Immigrants | Uruguay | 34.1 /100 | #186 | Fair 13.7% |
| Slovaks | 34.1 /100 | #187 | Fair 13.7% |
| Immigrants | Eritrea | 32.7 /100 | #188 | Fair 13.7% |
| Finns | 32.5 /100 | #189 | Fair 13.7% |
Demographics Similar to Sri Lankans by Female Poverty Among 25-34 Year Olds
In terms of female poverty among 25-34 year olds, the demographic groups most similar to Sri Lankans are Immigrants from Lebanon (12.2%, a difference of 0.030%), Immigrants from Belgium (12.2%, a difference of 0.060%), Immigrants from Scotland (12.2%, a difference of 0.070%), Lithuanian (12.2%, a difference of 0.12%), and Laotian (12.2%, a difference of 0.21%).
| Demographics | Rating | Rank | Female Poverty Among 25-34 Year Olds |
| Immigrants | Czechoslovakia | 99.4 /100 | #61 | Exceptional 12.1% |
| Immigrants | Moldova | 99.3 /100 | #62 | Exceptional 12.1% |
| Soviet Union | 99.3 /100 | #63 | Exceptional 12.1% |
| Immigrants | Russia | 99.2 /100 | #64 | Exceptional 12.2% |
| Armenians | 99.2 /100 | #65 | Exceptional 12.2% |
| Immigrants | Europe | 99.2 /100 | #66 | Exceptional 12.2% |
| Laotians | 99.2 /100 | #67 | Exceptional 12.2% |
| Sri Lankans | 99.1 /100 | #68 | Exceptional 12.2% |
| Immigrants | Lebanon | 99.1 /100 | #69 | Exceptional 12.2% |
| Immigrants | Belgium | 99.1 /100 | #70 | Exceptional 12.2% |
| Immigrants | Scotland | 99.1 /100 | #71 | Exceptional 12.2% |
| Lithuanians | 99.1 /100 | #72 | Exceptional 12.2% |
| Immigrants | Vietnam | 98.9 /100 | #73 | Exceptional 12.3% |
| Immigrants | Sweden | 98.9 /100 | #74 | Exceptional 12.3% |
| Estonians | 98.9 /100 | #75 | Exceptional 12.3% |