Immigrants from Uzbekistan vs Hungarian Single Male Poverty
COMPARE
Immigrants from Uzbekistan
Hungarian
Single Male Poverty
Single Male Poverty Comparison
Immigrants from Uzbekistan
Hungarians
11.7%
SINGLE MALE POVERTY
99.9/ 100
METRIC RATING
54th/ 347
METRIC RANK
13.8%
SINGLE MALE POVERTY
0.3/ 100
METRIC RATING
261st/ 347
METRIC RANK
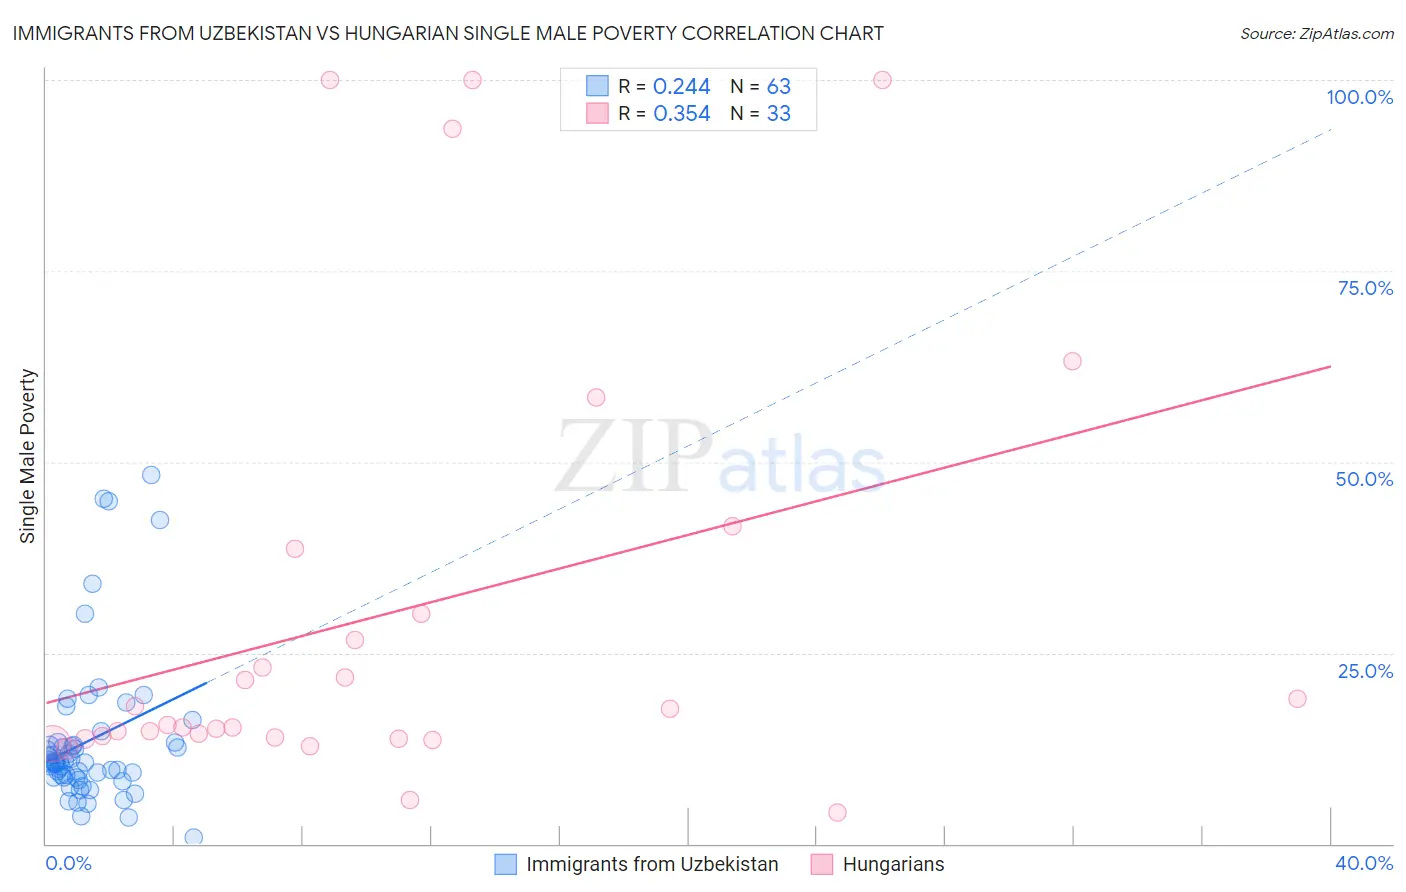
Immigrants from Uzbekistan vs Hungarian Single Male Poverty Correlation Chart
The statistical analysis conducted on geographies consisting of 112,516,380 people shows a weak positive correlation between the proportion of Immigrants from Uzbekistan and poverty level among single males in the United States with a correlation coefficient (R) of 0.244 and weighted average of 11.7%. Similarly, the statistical analysis conducted on geographies consisting of 413,693,148 people shows a mild positive correlation between the proportion of Hungarians and poverty level among single males in the United States with a correlation coefficient (R) of 0.354 and weighted average of 13.8%, a difference of 18.1%.
Single Male Poverty Correlation Summary
| Measurement | Immigrants from Uzbekistan | Hungarian |
| Minimum | 0.78% | 4.0% |
| Maximum | 48.3% | 100.0% |
| Range | 47.5% | 96.0% |
| Mean | 13.5% | 30.2% |
| Median | 10.7% | 15.5% |
| Interquartile 25% (IQ1) | 8.7% | 13.9% |
| Interquartile 75% (IQ3) | 13.3% | 34.3% |
| Interquartile Range (IQR) | 4.5% | 20.5% |
| Standard Deviation (Sample) | 9.9% | 28.8% |
| Standard Deviation (Population) | 9.9% | 28.4% |
Similar Demographics by Single Male Poverty
Demographics Similar to Immigrants from Uzbekistan by Single Male Poverty
In terms of single male poverty, the demographic groups most similar to Immigrants from Uzbekistan are Bulgarian (11.7%, a difference of 0.020%), Samoan (11.7%, a difference of 0.12%), Cypriot (11.7%, a difference of 0.17%), Paraguayan (11.6%, a difference of 0.43%), and Burmese (11.7%, a difference of 0.48%).
| Demographics | Rating | Rank | Single Male Poverty |
| Nepalese | 99.9 /100 | #47 | Exceptional 11.6% |
| Immigrants | Indonesia | 99.9 /100 | #48 | Exceptional 11.6% |
| Tlingit-Haida | 99.9 /100 | #49 | Exceptional 11.6% |
| Immigrants | Lithuania | 99.9 /100 | #50 | Exceptional 11.6% |
| Paraguayans | 99.9 /100 | #51 | Exceptional 11.6% |
| Samoans | 99.9 /100 | #52 | Exceptional 11.7% |
| Bulgarians | 99.9 /100 | #53 | Exceptional 11.7% |
| Immigrants | Uzbekistan | 99.9 /100 | #54 | Exceptional 11.7% |
| Cypriots | 99.9 /100 | #55 | Exceptional 11.7% |
| Burmese | 99.8 /100 | #56 | Exceptional 11.7% |
| Immigrants | Romania | 99.8 /100 | #57 | Exceptional 11.7% |
| Immigrants | Brazil | 99.8 /100 | #58 | Exceptional 11.7% |
| Brazilians | 99.8 /100 | #59 | Exceptional 11.8% |
| Peruvians | 99.8 /100 | #60 | Exceptional 11.8% |
| Cambodians | 99.8 /100 | #61 | Exceptional 11.8% |
Demographics Similar to Hungarians by Single Male Poverty
In terms of single male poverty, the demographic groups most similar to Hungarians are Swiss (13.8%, a difference of 0.050%), Guatemalan (13.8%, a difference of 0.12%), Immigrants from Guatemala (13.8%, a difference of 0.16%), Fijian (13.8%, a difference of 0.17%), and Immigrants from Central America (13.8%, a difference of 0.23%).
| Demographics | Rating | Rank | Single Male Poverty |
| Sub-Saharan Africans | 0.5 /100 | #254 | Tragic 13.7% |
| Spaniards | 0.4 /100 | #255 | Tragic 13.7% |
| Immigrants | Belize | 0.4 /100 | #256 | Tragic 13.7% |
| Immigrants | Central America | 0.3 /100 | #257 | Tragic 13.8% |
| Immigrants | Guatemala | 0.3 /100 | #258 | Tragic 13.8% |
| Guatemalans | 0.3 /100 | #259 | Tragic 13.8% |
| Swiss | 0.3 /100 | #260 | Tragic 13.8% |
| Hungarians | 0.3 /100 | #261 | Tragic 13.8% |
| Fijians | 0.3 /100 | #262 | Tragic 13.8% |
| Cape Verdeans | 0.2 /100 | #263 | Tragic 13.8% |
| West Indians | 0.2 /100 | #264 | Tragic 13.8% |
| Immigrants | Congo | 0.2 /100 | #265 | Tragic 13.9% |
| Immigrants | Cabo Verde | 0.1 /100 | #266 | Tragic 13.9% |
| Germans | 0.1 /100 | #267 | Tragic 13.9% |
| Immigrants | Mexico | 0.1 /100 | #268 | Tragic 13.9% |