Immigrants from Uzbekistan vs Bermudan Seniors Poverty Over the Age of 75
COMPARE
Immigrants from Uzbekistan
Bermudan
Seniors Poverty Over the Age of 75
Seniors Poverty Over the Age of 75 Comparison
Immigrants from Uzbekistan
Bermudans
16.5%
SENIORS POVERTY OVER THE AGE OF 75
0.0/ 100
METRIC RATING
324th/ 347
METRIC RANK
12.9%
SENIORS POVERTY OVER THE AGE OF 75
4.9/ 100
METRIC RATING
217th/ 347
METRIC RANK
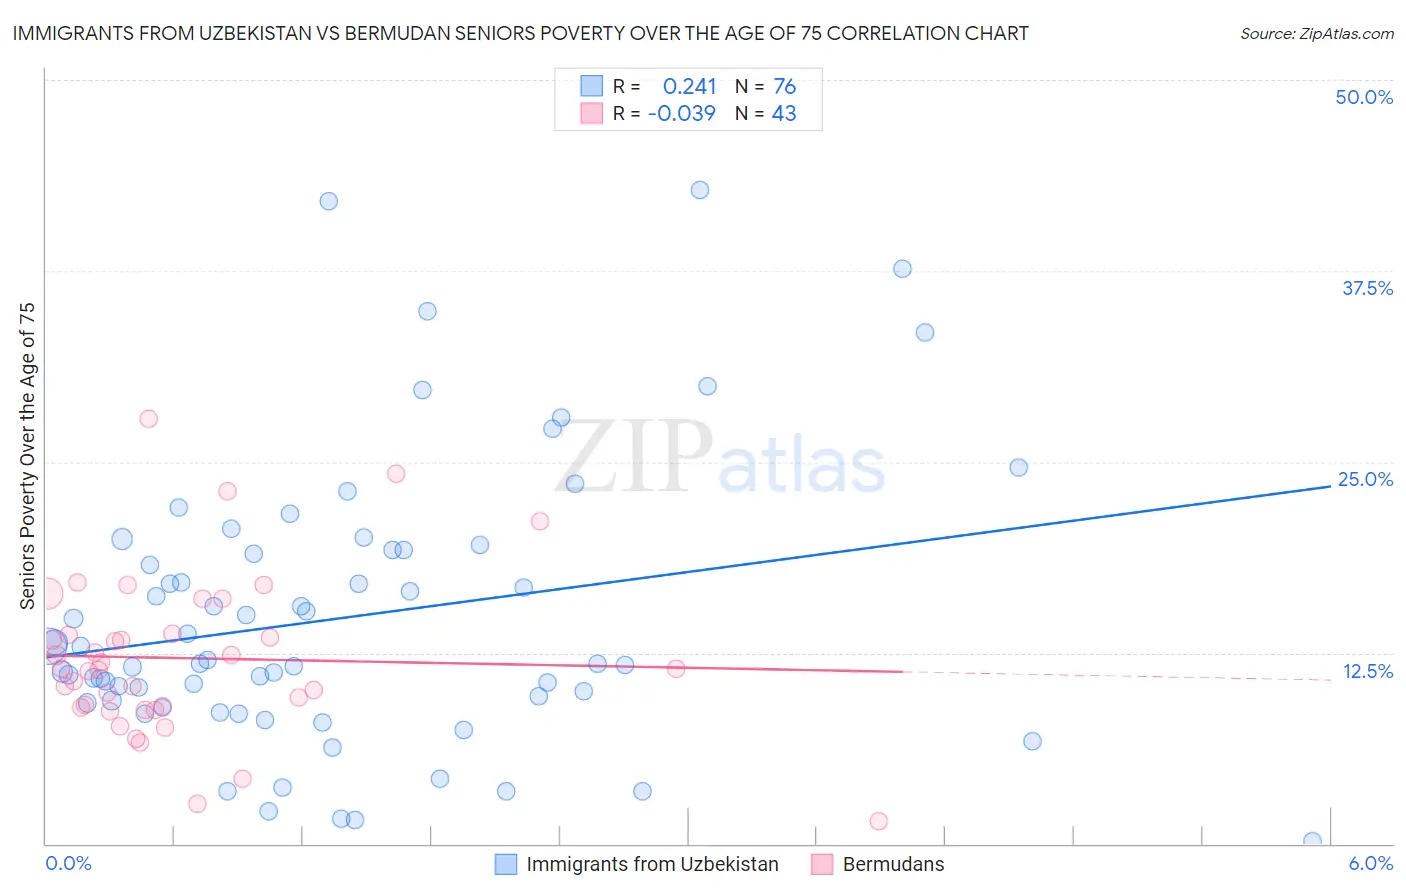
Immigrants from Uzbekistan vs Bermudan Seniors Poverty Over the Age of 75 Correlation Chart
The statistical analysis conducted on geographies consisting of 118,161,446 people shows a weak positive correlation between the proportion of Immigrants from Uzbekistan and poverty level among seniors over the age of 75 in the United States with a correlation coefficient (R) of 0.241 and weighted average of 16.5%. Similarly, the statistical analysis conducted on geographies consisting of 55,508,519 people shows no correlation between the proportion of Bermudans and poverty level among seniors over the age of 75 in the United States with a correlation coefficient (R) of -0.039 and weighted average of 12.9%, a difference of 28.1%.
Seniors Poverty Over the Age of 75 Correlation Summary
| Measurement | Immigrants from Uzbekistan | Bermudan |
| Minimum | 0.17% | 1.5% |
| Maximum | 42.8% | 27.8% |
| Range | 42.6% | 26.3% |
| Mean | 14.8% | 12.1% |
| Median | 11.9% | 11.5% |
| Interquartile 25% (IQ1) | 9.3% | 8.9% |
| Interquartile 75% (IQ3) | 19.2% | 13.8% |
| Interquartile Range (IQR) | 9.9% | 4.9% |
| Standard Deviation (Sample) | 9.1% | 5.3% |
| Standard Deviation (Population) | 9.1% | 5.2% |
Similar Demographics by Seniors Poverty Over the Age of 75
Demographics Similar to Immigrants from Uzbekistan by Seniors Poverty Over the Age of 75
In terms of seniors poverty over the age of 75, the demographic groups most similar to Immigrants from Uzbekistan are Central American Indian (16.5%, a difference of 0.050%), Immigrants from Barbados (16.5%, a difference of 0.14%), Immigrants from Haiti (16.5%, a difference of 0.16%), Immigrants from Yemen (16.5%, a difference of 0.35%), and Nicaraguan (16.6%, a difference of 0.38%).
| Demographics | Rating | Rank | Seniors Poverty Over the Age of 75 |
| Immigrants | Guyana | 0.0 /100 | #317 | Tragic 16.2% |
| Houma | 0.0 /100 | #318 | Tragic 16.2% |
| Haitians | 0.0 /100 | #319 | Tragic 16.2% |
| Immigrants | Yemen | 0.0 /100 | #320 | Tragic 16.5% |
| Immigrants | Haiti | 0.0 /100 | #321 | Tragic 16.5% |
| Immigrants | Barbados | 0.0 /100 | #322 | Tragic 16.5% |
| Central American Indians | 0.0 /100 | #323 | Tragic 16.5% |
| Immigrants | Uzbekistan | 0.0 /100 | #324 | Tragic 16.5% |
| Nicaraguans | 0.0 /100 | #325 | Tragic 16.6% |
| Pueblo | 0.0 /100 | #326 | Tragic 16.7% |
| Sioux | 0.0 /100 | #327 | Tragic 16.8% |
| Cape Verdeans | 0.0 /100 | #328 | Tragic 16.8% |
| Immigrants | Dominica | 0.0 /100 | #329 | Tragic 17.0% |
| British West Indians | 0.0 /100 | #330 | Tragic 17.4% |
| Immigrants | Armenia | 0.0 /100 | #331 | Tragic 17.5% |
Demographics Similar to Bermudans by Seniors Poverty Over the Age of 75
In terms of seniors poverty over the age of 75, the demographic groups most similar to Bermudans are Immigrants from Western Asia (12.9%, a difference of 0.030%), Ute (12.9%, a difference of 0.090%), Immigrants from Brazil (12.9%, a difference of 0.10%), Seminole (12.9%, a difference of 0.20%), and South American Indian (12.9%, a difference of 0.22%).
| Demographics | Rating | Rank | Seniors Poverty Over the Age of 75 |
| Comanche | 7.0 /100 | #210 | Tragic 12.8% |
| Brazilians | 6.9 /100 | #211 | Tragic 12.8% |
| Immigrants | Hong Kong | 6.5 /100 | #212 | Tragic 12.8% |
| French American Indians | 6.1 /100 | #213 | Tragic 12.9% |
| Immigrants | Africa | 5.9 /100 | #214 | Tragic 12.9% |
| South American Indians | 5.5 /100 | #215 | Tragic 12.9% |
| Immigrants | Brazil | 5.2 /100 | #216 | Tragic 12.9% |
| Bermudans | 4.9 /100 | #217 | Tragic 12.9% |
| Immigrants | Western Asia | 4.9 /100 | #218 | Tragic 12.9% |
| Ute | 4.7 /100 | #219 | Tragic 12.9% |
| Seminole | 4.5 /100 | #220 | Tragic 12.9% |
| Immigrants | Kazakhstan | 4.3 /100 | #221 | Tragic 13.0% |
| Nigerians | 3.4 /100 | #222 | Tragic 13.0% |
| Immigrants | Nigeria | 3.3 /100 | #223 | Tragic 13.0% |
| Chippewa | 2.9 /100 | #224 | Tragic 13.1% |