Immigrants from Ukraine vs Yup'ik Single Father Poverty
COMPARE
Immigrants from Ukraine
Yup'ik
Single Father Poverty
Single Father Poverty Comparison
Immigrants from Ukraine
Yup'ik
15.4%
SINGLE FATHER POVERTY
99.4/ 100
METRIC RATING
82nd/ 347
METRIC RANK
32.5%
SINGLE FATHER POVERTY
0.0/ 100
METRIC RATING
347th/ 347
METRIC RANK
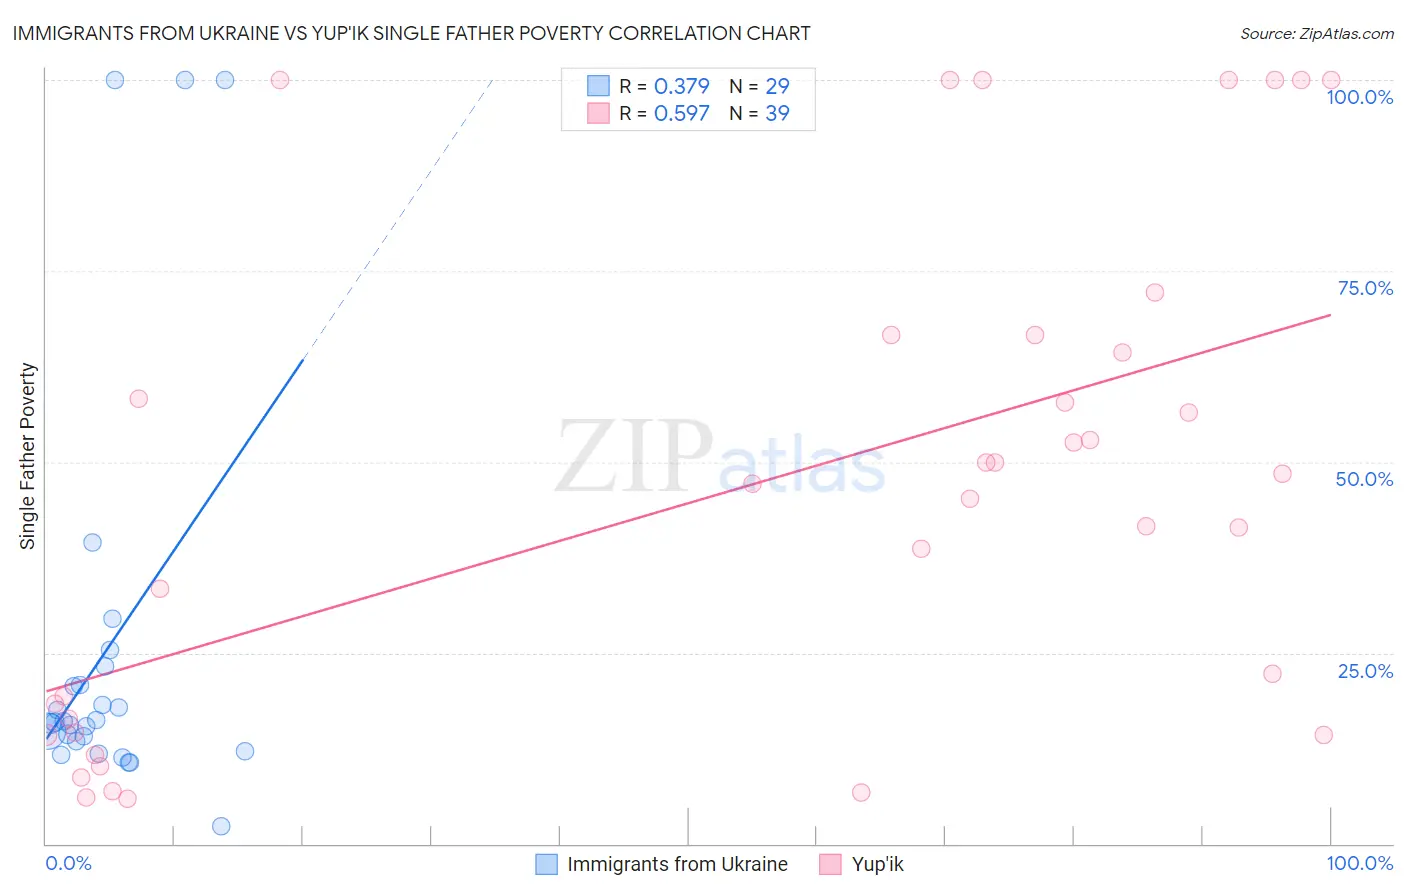
Immigrants from Ukraine vs Yup'ik Single Father Poverty Correlation Chart
The statistical analysis conducted on geographies consisting of 230,818,529 people shows a mild positive correlation between the proportion of Immigrants from Ukraine and poverty level among single fathers in the United States with a correlation coefficient (R) of 0.379 and weighted average of 15.4%. Similarly, the statistical analysis conducted on geographies consisting of 37,532,100 people shows a substantial positive correlation between the proportion of Yup'ik and poverty level among single fathers in the United States with a correlation coefficient (R) of 0.597 and weighted average of 32.5%, a difference of 111.3%.
Single Father Poverty Correlation Summary
| Measurement | Immigrants from Ukraine | Yup'ik |
| Minimum | 2.4% | 5.9% |
| Maximum | 100.0% | 100.0% |
| Range | 97.6% | 94.1% |
| Mean | 25.3% | 46.6% |
| Median | 15.9% | 47.1% |
| Interquartile 25% (IQ1) | 12.7% | 14.6% |
| Interquartile 75% (IQ3) | 22.0% | 66.7% |
| Interquartile Range (IQR) | 9.3% | 52.0% |
| Standard Deviation (Sample) | 26.7% | 32.1% |
| Standard Deviation (Population) | 26.2% | 31.7% |
Similar Demographics by Single Father Poverty
Demographics Similar to Immigrants from Ukraine by Single Father Poverty
In terms of single father poverty, the demographic groups most similar to Immigrants from Ukraine are Immigrants from Congo (15.4%, a difference of 0.010%), Armenian (15.4%, a difference of 0.030%), Chinese (15.4%, a difference of 0.090%), Peruvian (15.4%, a difference of 0.22%), and Immigrants from Northern Africa (15.3%, a difference of 0.26%).
| Demographics | Rating | Rank | Single Father Poverty |
| Immigrants | Turkey | 99.5 /100 | #75 | Exceptional 15.3% |
| Immigrants | Japan | 99.5 /100 | #76 | Exceptional 15.3% |
| Immigrants | Peru | 99.5 /100 | #77 | Exceptional 15.3% |
| Tlingit-Haida | 99.5 /100 | #78 | Exceptional 15.3% |
| Immigrants | Northern Africa | 99.5 /100 | #79 | Exceptional 15.3% |
| Armenians | 99.4 /100 | #80 | Exceptional 15.4% |
| Immigrants | Congo | 99.4 /100 | #81 | Exceptional 15.4% |
| Immigrants | Ukraine | 99.4 /100 | #82 | Exceptional 15.4% |
| Chinese | 99.3 /100 | #83 | Exceptional 15.4% |
| Peruvians | 99.2 /100 | #84 | Exceptional 15.4% |
| Immigrants | Oceania | 99.1 /100 | #85 | Exceptional 15.4% |
| Immigrants | Russia | 99.0 /100 | #86 | Exceptional 15.5% |
| Brazilians | 99.0 /100 | #87 | Exceptional 15.5% |
| Burmese | 99.0 /100 | #88 | Exceptional 15.5% |
| Immigrants | Korea | 99.0 /100 | #89 | Exceptional 15.5% |
Demographics Similar to Yup'ik by Single Father Poverty
In terms of single father poverty, the demographic groups most similar to Yup'ik are Puerto Rican (31.5%, a difference of 3.2%), Crow (30.3%, a difference of 7.4%), Navajo (29.2%, a difference of 11.3%), Lumbee (28.5%, a difference of 14.2%), and Yuman (28.4%, a difference of 14.6%).
| Demographics | Rating | Rank | Single Father Poverty |
| Natives/Alaskans | 0.0 /100 | #333 | Tragic 22.4% |
| Kiowa | 0.0 /100 | #334 | Tragic 22.5% |
| Shoshone | 0.0 /100 | #335 | Tragic 22.9% |
| Cajuns | 0.0 /100 | #336 | Tragic 23.1% |
| Sioux | 0.0 /100 | #337 | Tragic 23.9% |
| Arapaho | 0.0 /100 | #338 | Tragic 24.0% |
| Apache | 0.0 /100 | #339 | Tragic 24.2% |
| Houma | 0.0 /100 | #340 | Tragic 26.7% |
| Hopi | 0.0 /100 | #341 | Tragic 27.2% |
| Yuman | 0.0 /100 | #342 | Tragic 28.4% |
| Lumbee | 0.0 /100 | #343 | Tragic 28.5% |
| Navajo | 0.0 /100 | #344 | Tragic 29.2% |
| Crow | 0.0 /100 | #345 | Tragic 30.3% |
| Puerto Ricans | 0.0 /100 | #346 | Tragic 31.5% |
| Yup'ik | 0.0 /100 | #347 | Tragic 32.5% |