Immigrants from Ukraine vs Lithuanian Family Poverty
COMPARE
Immigrants from Ukraine
Lithuanian
Family Poverty
Family Poverty Comparison
Immigrants from Ukraine
Lithuanians
8.5%
FAMILY POVERTY
83.9/ 100
METRIC RATING
141st/ 347
METRIC RANK
7.2%
FAMILY POVERTY
99.8/ 100
METRIC RATING
15th/ 347
METRIC RANK
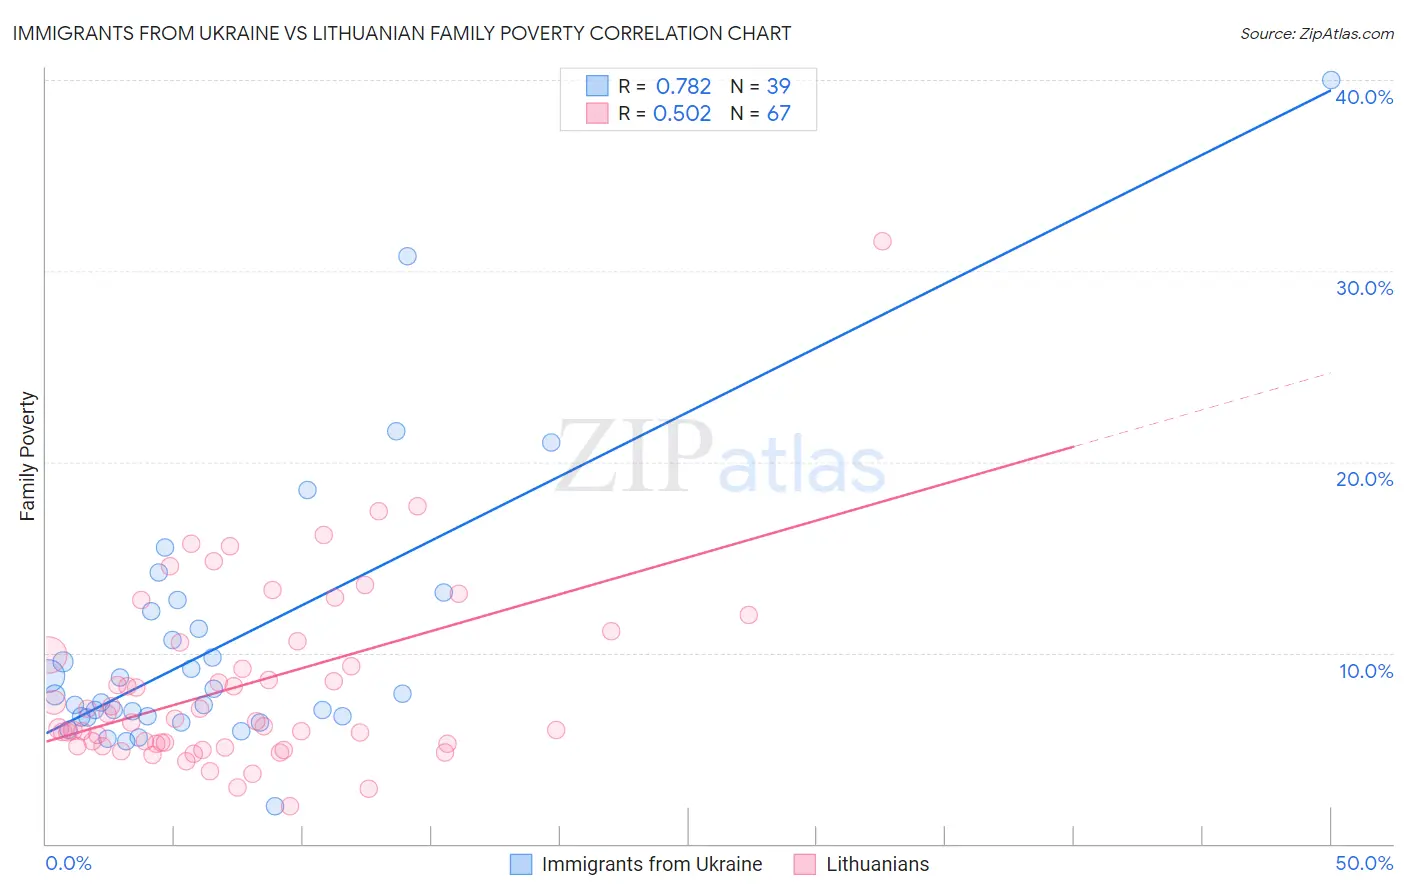
Immigrants from Ukraine vs Lithuanian Family Poverty Correlation Chart
The statistical analysis conducted on geographies consisting of 289,107,517 people shows a strong positive correlation between the proportion of Immigrants from Ukraine and poverty level among families in the United States with a correlation coefficient (R) of 0.782 and weighted average of 8.5%. Similarly, the statistical analysis conducted on geographies consisting of 420,202,329 people shows a substantial positive correlation between the proportion of Lithuanians and poverty level among families in the United States with a correlation coefficient (R) of 0.502 and weighted average of 7.2%, a difference of 18.6%.
Family Poverty Correlation Summary
| Measurement | Immigrants from Ukraine | Lithuanian |
| Minimum | 2.0% | 2.0% |
| Maximum | 40.0% | 31.6% |
| Range | 38.0% | 29.6% |
| Mean | 10.5% | 8.3% |
| Median | 7.8% | 6.4% |
| Interquartile 25% (IQ1) | 6.6% | 5.2% |
| Interquartile 75% (IQ3) | 12.2% | 10.5% |
| Interquartile Range (IQR) | 5.5% | 5.3% |
| Standard Deviation (Sample) | 7.3% | 4.8% |
| Standard Deviation (Population) | 7.2% | 4.8% |
Similar Demographics by Family Poverty
Demographics Similar to Immigrants from Ukraine by Family Poverty
In terms of family poverty, the demographic groups most similar to Immigrants from Ukraine are Immigrants from Kazakhstan (8.5%, a difference of 0.030%), Immigrants from Nepal (8.5%, a difference of 0.060%), Yugoslavian (8.5%, a difference of 0.11%), Immigrants from Germany (8.5%, a difference of 0.15%), and Albanian (8.5%, a difference of 0.16%).
| Demographics | Rating | Rank | Family Poverty |
| Chileans | 86.6 /100 | #134 | Excellent 8.5% |
| Immigrants | Malaysia | 86.5 /100 | #135 | Excellent 8.5% |
| Immigrants | Brazil | 86.3 /100 | #136 | Excellent 8.5% |
| Immigrants | Southern Europe | 86.0 /100 | #137 | Excellent 8.5% |
| Armenians | 84.6 /100 | #138 | Excellent 8.5% |
| Immigrants | Nepal | 84.2 /100 | #139 | Excellent 8.5% |
| Immigrants | Kazakhstan | 84.1 /100 | #140 | Excellent 8.5% |
| Immigrants | Ukraine | 83.9 /100 | #141 | Excellent 8.5% |
| Yugoslavians | 83.5 /100 | #142 | Excellent 8.5% |
| Immigrants | Germany | 83.3 /100 | #143 | Excellent 8.5% |
| Albanians | 83.3 /100 | #144 | Excellent 8.5% |
| Immigrants | South Eastern Asia | 83.2 /100 | #145 | Excellent 8.5% |
| Immigrants | Belarus | 83.2 /100 | #146 | Excellent 8.5% |
| Immigrants | Jordan | 83.0 /100 | #147 | Excellent 8.5% |
| Scotch-Irish | 82.2 /100 | #148 | Excellent 8.6% |
Demographics Similar to Lithuanians by Family Poverty
In terms of family poverty, the demographic groups most similar to Lithuanians are Immigrants from South Central Asia (7.2%, a difference of 0.27%), Luxembourger (7.2%, a difference of 0.50%), Immigrants from Lithuania (7.2%, a difference of 0.51%), Eastern European (7.2%, a difference of 0.81%), and Swedish (7.1%, a difference of 0.88%).
| Demographics | Rating | Rank | Family Poverty |
| Bhutanese | 99.9 /100 | #8 | Exceptional 7.0% |
| Latvians | 99.9 /100 | #9 | Exceptional 7.1% |
| Bulgarians | 99.8 /100 | #10 | Exceptional 7.1% |
| Immigrants | Singapore | 99.8 /100 | #11 | Exceptional 7.1% |
| Maltese | 99.8 /100 | #12 | Exceptional 7.1% |
| Swedes | 99.8 /100 | #13 | Exceptional 7.1% |
| Iranians | 99.8 /100 | #14 | Exceptional 7.1% |
| Lithuanians | 99.8 /100 | #15 | Exceptional 7.2% |
| Immigrants | South Central Asia | 99.8 /100 | #16 | Exceptional 7.2% |
| Luxembourgers | 99.8 /100 | #17 | Exceptional 7.2% |
| Immigrants | Lithuania | 99.8 /100 | #18 | Exceptional 7.2% |
| Eastern Europeans | 99.7 /100 | #19 | Exceptional 7.2% |
| Immigrants | Hong Kong | 99.7 /100 | #20 | Exceptional 7.3% |
| Immigrants | Iran | 99.7 /100 | #21 | Exceptional 7.3% |
| Danes | 99.7 /100 | #22 | Exceptional 7.3% |