Immigrants from Uganda vs Immigrants from Uzbekistan Seniors Poverty Over the Age of 65
COMPARE
Immigrants from Uganda
Immigrants from Uzbekistan
Seniors Poverty Over the Age of 65
Seniors Poverty Over the Age of 65 Comparison
Immigrants from Uganda
Immigrants from Uzbekistan
11.1%
SENIORS POVERTY OVER THE AGE OF 65
32.2/ 100
METRIC RATING
191st/ 347
METRIC RANK
14.0%
SENIORS POVERTY OVER THE AGE OF 65
0.0/ 100
METRIC RATING
300th/ 347
METRIC RANK
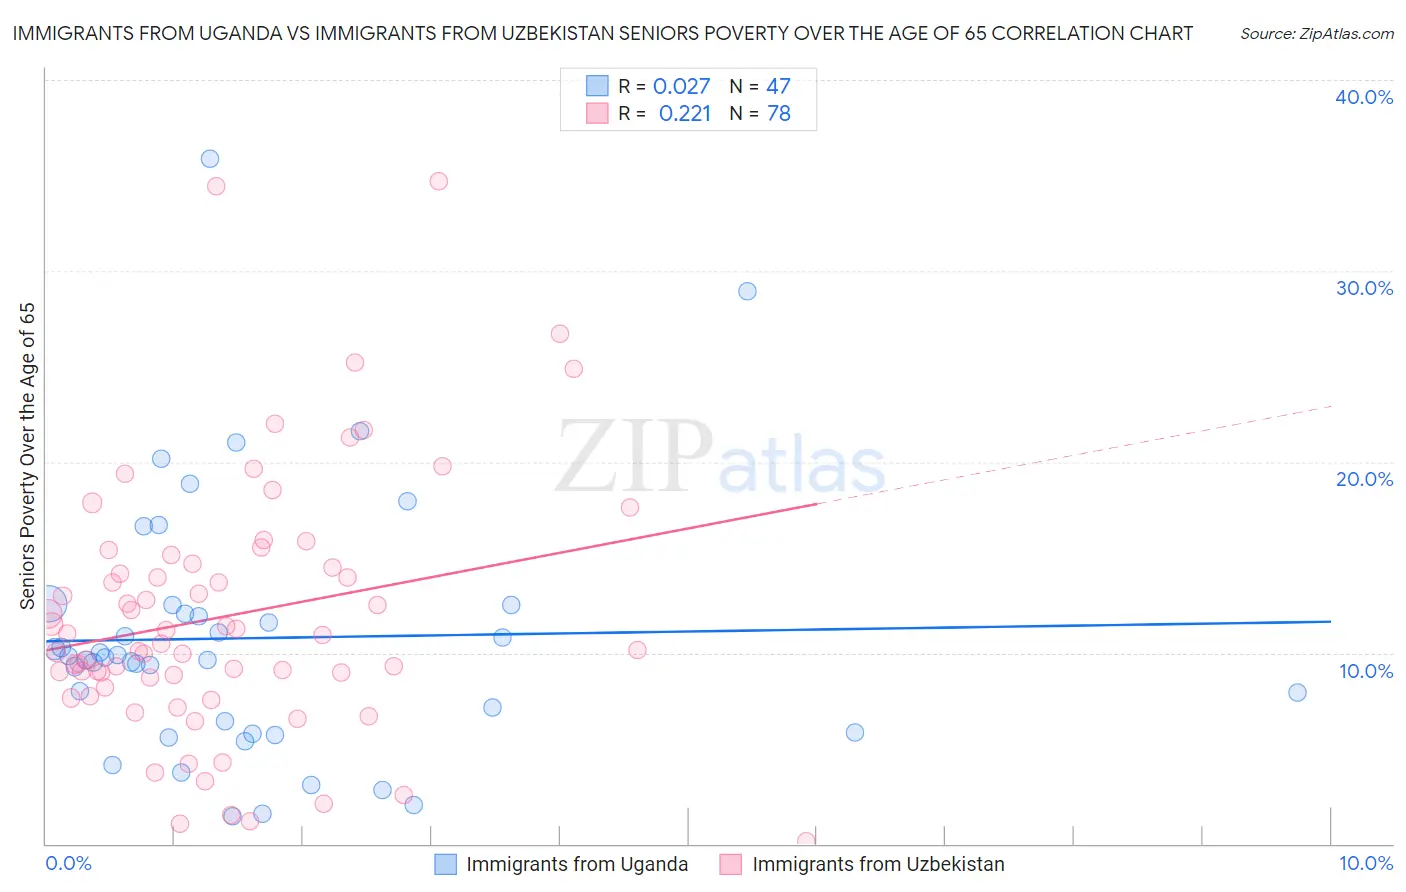
Immigrants from Uganda vs Immigrants from Uzbekistan Seniors Poverty Over the Age of 65 Correlation Chart
The statistical analysis conducted on geographies consisting of 125,911,000 people shows no correlation between the proportion of Immigrants from Uganda and poverty level among seniors over the age of 65 in the United States with a correlation coefficient (R) of 0.027 and weighted average of 11.1%. Similarly, the statistical analysis conducted on geographies consisting of 118,571,823 people shows a weak positive correlation between the proportion of Immigrants from Uzbekistan and poverty level among seniors over the age of 65 in the United States with a correlation coefficient (R) of 0.221 and weighted average of 14.0%, a difference of 26.1%.
Seniors Poverty Over the Age of 65 Correlation Summary
| Measurement | Immigrants from Uganda | Immigrants from Uzbekistan |
| Minimum | 1.4% | 0.12% |
| Maximum | 35.9% | 34.7% |
| Range | 34.5% | 34.6% |
| Mean | 10.8% | 12.0% |
| Median | 9.7% | 10.7% |
| Interquartile 25% (IQ1) | 5.8% | 8.7% |
| Interquartile 75% (IQ3) | 12.5% | 14.7% |
| Interquartile Range (IQR) | 6.7% | 6.0% |
| Standard Deviation (Sample) | 6.8% | 6.8% |
| Standard Deviation (Population) | 6.7% | 6.7% |
Similar Demographics by Seniors Poverty Over the Age of 65
Demographics Similar to Immigrants from Uganda by Seniors Poverty Over the Age of 65
In terms of seniors poverty over the age of 65, the demographic groups most similar to Immigrants from Uganda are Indian (Asian) (11.1%, a difference of 0.20%), Immigrants from Southern Europe (11.1%, a difference of 0.22%), Taiwanese (11.2%, a difference of 0.30%), Immigrants from Laos (11.1%, a difference of 0.34%), and Immigrants from Hong Kong (11.1%, a difference of 0.40%).
| Demographics | Rating | Rank | Seniors Poverty Over the Age of 65 |
| Immigrants | France | 40.9 /100 | #184 | Average 11.0% |
| Immigrants | Lebanon | 38.2 /100 | #185 | Fair 11.1% |
| Immigrants | Eastern Asia | 37.5 /100 | #186 | Fair 11.1% |
| Immigrants | Middle Africa | 37.4 /100 | #187 | Fair 11.1% |
| Immigrants | Hong Kong | 36.3 /100 | #188 | Fair 11.1% |
| Immigrants | Laos | 35.7 /100 | #189 | Fair 11.1% |
| Indians (Asian) | 34.2 /100 | #190 | Fair 11.1% |
| Immigrants | Uganda | 32.2 /100 | #191 | Fair 11.1% |
| Immigrants | Southern Europe | 30.1 /100 | #192 | Fair 11.1% |
| Taiwanese | 29.2 /100 | #193 | Fair 11.2% |
| Chileans | 27.8 /100 | #194 | Fair 11.2% |
| Immigrants | Vietnam | 26.6 /100 | #195 | Fair 11.2% |
| Bangladeshis | 25.2 /100 | #196 | Fair 11.2% |
| Albanians | 24.4 /100 | #197 | Fair 11.2% |
| Immigrants | Burma/Myanmar | 21.3 /100 | #198 | Fair 11.3% |
Demographics Similar to Immigrants from Uzbekistan by Seniors Poverty Over the Age of 65
In terms of seniors poverty over the age of 65, the demographic groups most similar to Immigrants from Uzbekistan are Ecuadorian (14.0%, a difference of 0.070%), Immigrants from Belize (14.0%, a difference of 0.15%), U.S. Virgin Islander (14.0%, a difference of 0.21%), Yup'ik (14.1%, a difference of 0.28%), and Immigrants from Bangladesh (14.1%, a difference of 0.39%).
| Demographics | Rating | Rank | Seniors Poverty Over the Age of 65 |
| Immigrants | Guatemala | 0.0 /100 | #293 | Tragic 13.8% |
| Cheyenne | 0.0 /100 | #294 | Tragic 13.9% |
| Apache | 0.0 /100 | #295 | Tragic 13.9% |
| Immigrants | Jamaica | 0.0 /100 | #296 | Tragic 13.9% |
| Vietnamese | 0.0 /100 | #297 | Tragic 14.0% |
| Immigrants | Belize | 0.0 /100 | #298 | Tragic 14.0% |
| Ecuadorians | 0.0 /100 | #299 | Tragic 14.0% |
| Immigrants | Uzbekistan | 0.0 /100 | #300 | Tragic 14.0% |
| U.S. Virgin Islanders | 0.0 /100 | #301 | Tragic 14.0% |
| Yup'ik | 0.0 /100 | #302 | Tragic 14.1% |
| Immigrants | Bangladesh | 0.0 /100 | #303 | Tragic 14.1% |
| West Indians | 0.0 /100 | #304 | Tragic 14.1% |
| Immigrants | Trinidad and Tobago | 0.0 /100 | #305 | Tragic 14.1% |
| Immigrants | Latin America | 0.0 /100 | #306 | Tragic 14.2% |
| Immigrants | West Indies | 0.0 /100 | #307 | Tragic 14.2% |