Immigrants from Uganda vs Immigrants from England Single Father Poverty
COMPARE
Immigrants from Uganda
Immigrants from England
Single Father Poverty
Single Father Poverty Comparison
Immigrants from Uganda
Immigrants from England
16.7%
SINGLE FATHER POVERTY
8.6/ 100
METRIC RATING
218th/ 347
METRIC RANK
16.7%
SINGLE FATHER POVERTY
9.5/ 100
METRIC RATING
216th/ 347
METRIC RANK
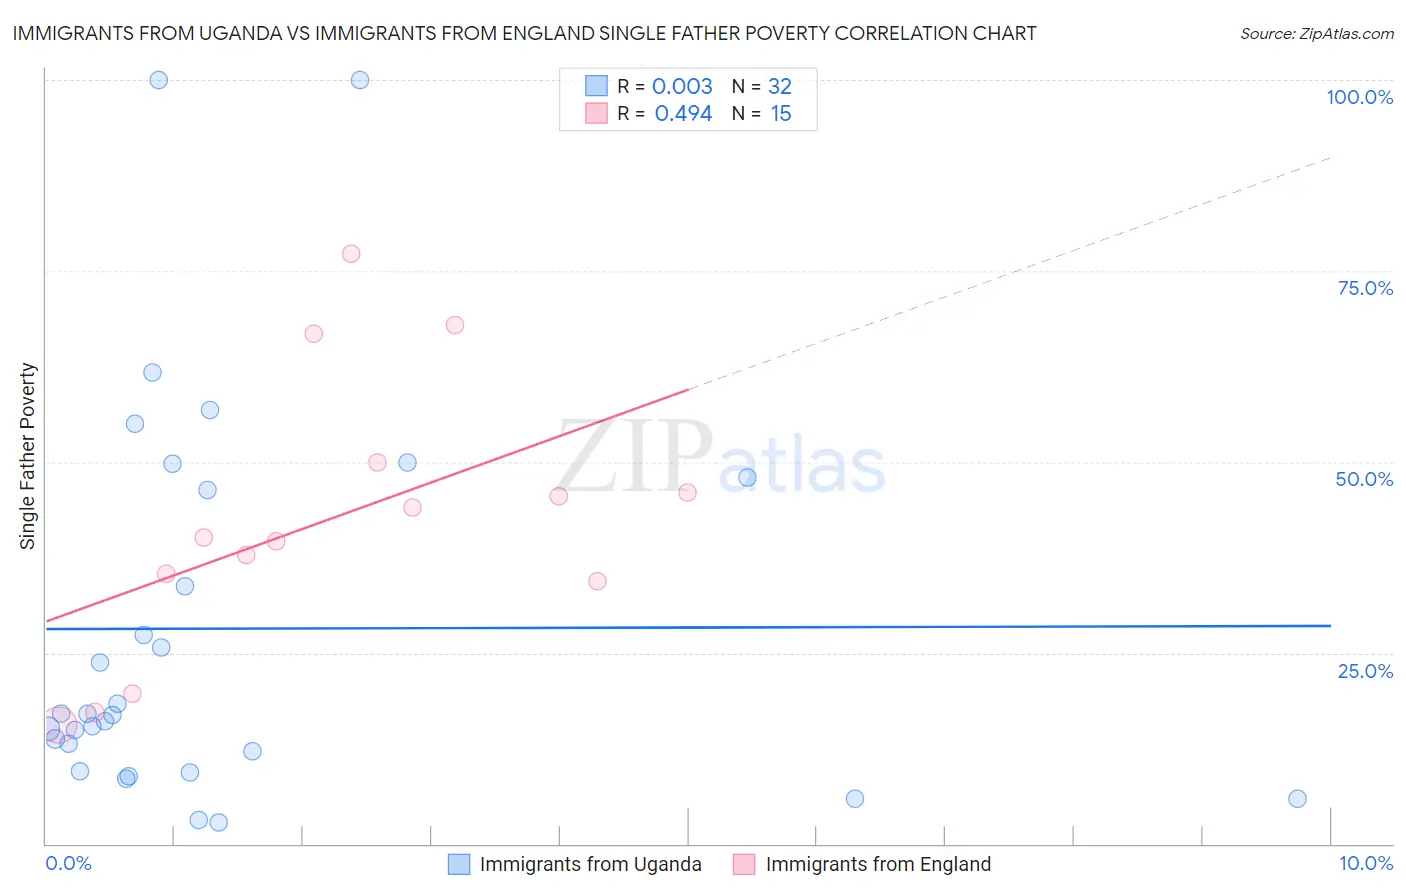
Immigrants from Uganda vs Immigrants from England Single Father Poverty Correlation Chart
The statistical analysis conducted on geographies consisting of 112,192,123 people shows no correlation between the proportion of Immigrants from Uganda and poverty level among single fathers in the United States with a correlation coefficient (R) of 0.003 and weighted average of 16.7%. Similarly, the statistical analysis conducted on geographies consisting of 303,741,945 people shows a moderate positive correlation between the proportion of Immigrants from England and poverty level among single fathers in the United States with a correlation coefficient (R) of 0.494 and weighted average of 16.7%, a difference of 0.13%.
Single Father Poverty Correlation Summary
| Measurement | Immigrants from Uganda | Immigrants from England |
| Minimum | 2.8% | 15.5% |
| Maximum | 100.0% | 77.3% |
| Range | 97.2% | 61.8% |
| Mean | 28.2% | 42.5% |
| Median | 16.9% | 40.2% |
| Interquartile 25% (IQ1) | 10.8% | 34.4% |
| Interquartile 75% (IQ3) | 47.1% | 49.9% |
| Interquartile Range (IQR) | 36.3% | 15.5% |
| Standard Deviation (Sample) | 25.6% | 18.1% |
| Standard Deviation (Population) | 25.2% | 17.4% |
Demographics Similar to Immigrants from Uganda and Immigrants from England by Single Father Poverty
In terms of single father poverty, the demographic groups most similar to Immigrants from Uganda are Immigrants from Ghana (16.7%, a difference of 0.060%), Immigrants from Denmark (16.7%, a difference of 0.070%), Immigrants from Greece (16.7%, a difference of 0.070%), Immigrants from Spain (16.7%, a difference of 0.070%), and Cheyenne (16.7%, a difference of 0.10%). Similarly, the demographic groups most similar to Immigrants from England are Immigrants from Scotland (16.7%, a difference of 0.0%), Cheyenne (16.7%, a difference of 0.030%), Spanish (16.7%, a difference of 0.14%), Ghanaian (16.7%, a difference of 0.17%), and Immigrants from Southern Europe (16.7%, a difference of 0.19%).
| Demographics | Rating | Rank | Single Father Poverty |
| New Zealanders | 13.7 /100 | #207 | Poor 16.6% |
| Eastern Europeans | 13.7 /100 | #208 | Poor 16.6% |
| Europeans | 13.2 /100 | #209 | Poor 16.6% |
| Guatemalans | 12.9 /100 | #210 | Poor 16.6% |
| Arabs | 12.8 /100 | #211 | Poor 16.6% |
| Immigrants | Southern Europe | 11.2 /100 | #212 | Poor 16.7% |
| Ghanaians | 11.0 /100 | #213 | Poor 16.7% |
| Spanish | 10.7 /100 | #214 | Poor 16.7% |
| Immigrants | Scotland | 9.6 /100 | #215 | Tragic 16.7% |
| Immigrants | England | 9.5 /100 | #216 | Tragic 16.7% |
| Cheyenne | 9.3 /100 | #217 | Tragic 16.7% |
| Immigrants | Uganda | 8.6 /100 | #218 | Tragic 16.7% |
| Immigrants | Ghana | 8.1 /100 | #219 | Tragic 16.7% |
| Immigrants | Denmark | 8.1 /100 | #220 | Tragic 16.7% |
| Immigrants | Greece | 8.1 /100 | #221 | Tragic 16.7% |
| Immigrants | Spain | 8.0 /100 | #222 | Tragic 16.7% |
| Immigrants | Austria | 7.0 /100 | #223 | Tragic 16.8% |
| Immigrants | Norway | 6.5 /100 | #224 | Tragic 16.8% |
| Menominee | 6.4 /100 | #225 | Tragic 16.8% |
| Hispanics or Latinos | 6.1 /100 | #226 | Tragic 16.8% |
| British | 5.6 /100 | #227 | Tragic 16.8% |