Immigrants from Turkey vs Immigrants from Taiwan Child Poverty Among Girls Under 16
COMPARE
Immigrants from Turkey
Immigrants from Taiwan
Child Poverty Among Girls Under 16
Child Poverty Among Girls Under 16 Comparison
Immigrants from Turkey
Immigrants from Taiwan
14.7%
CHILD POVERTY AMONG GIRLS UNDER 16
97.9/ 100
METRIC RATING
79th/ 347
METRIC RANK
11.3%
CHILD POVERTY AMONG GIRLS UNDER 16
100.0/ 100
METRIC RATING
2nd/ 347
METRIC RANK
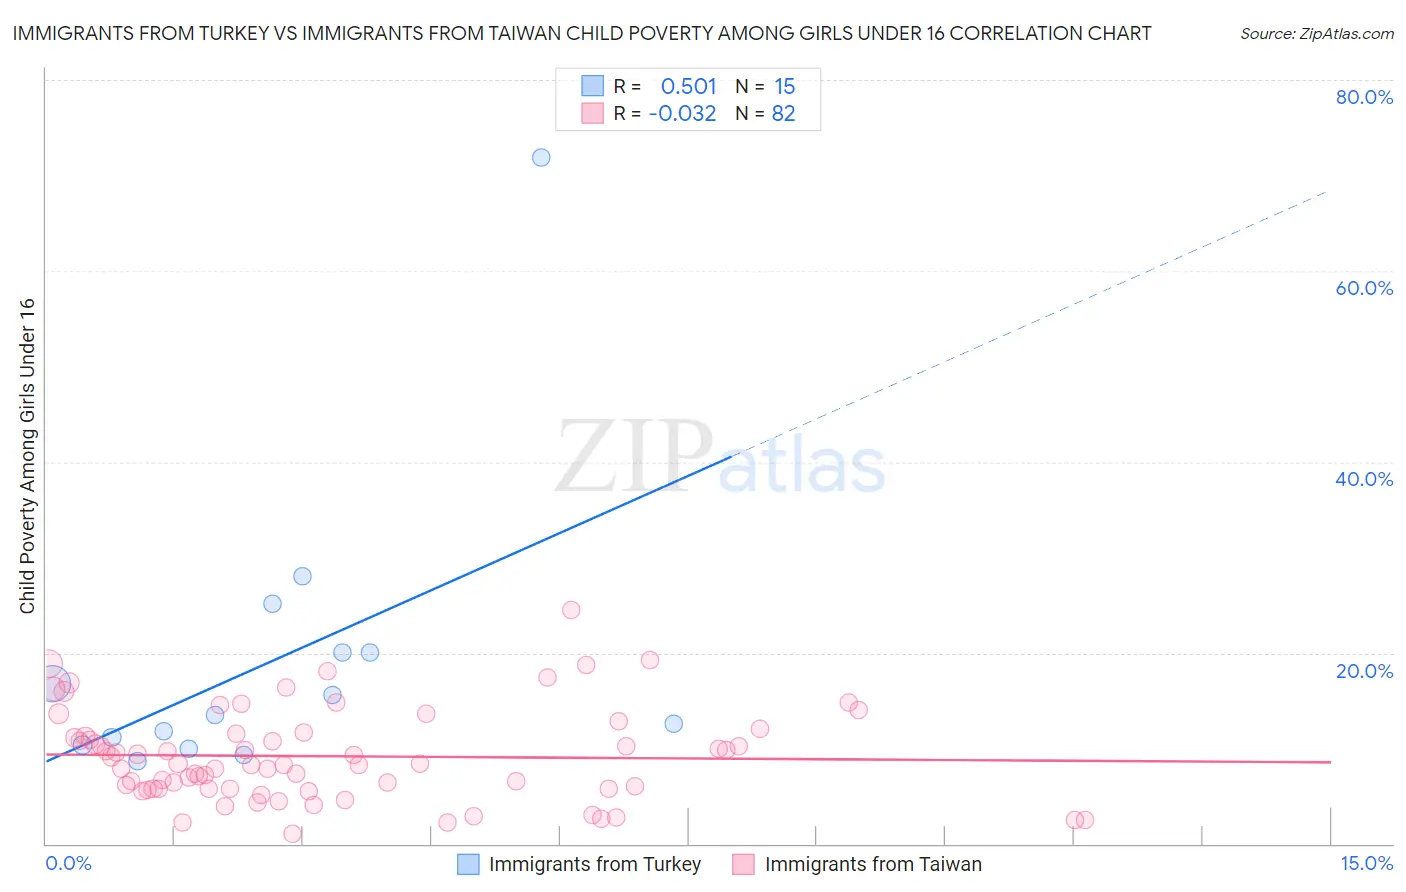
Immigrants from Turkey vs Immigrants from Taiwan Child Poverty Among Girls Under 16 Correlation Chart
The statistical analysis conducted on geographies consisting of 219,871,426 people shows a substantial positive correlation between the proportion of Immigrants from Turkey and poverty level among girls under the age of 16 in the United States with a correlation coefficient (R) of 0.501 and weighted average of 14.7%. Similarly, the statistical analysis conducted on geographies consisting of 293,199,111 people shows no correlation between the proportion of Immigrants from Taiwan and poverty level among girls under the age of 16 in the United States with a correlation coefficient (R) of -0.032 and weighted average of 11.3%, a difference of 29.5%.
Child Poverty Among Girls Under 16 Correlation Summary
| Measurement | Immigrants from Turkey | Immigrants from Taiwan |
| Minimum | 8.6% | 1.1% |
| Maximum | 71.9% | 24.4% |
| Range | 63.3% | 23.4% |
| Mean | 19.0% | 9.2% |
| Median | 13.5% | 8.3% |
| Interquartile 25% (IQ1) | 10.3% | 5.8% |
| Interquartile 75% (IQ3) | 20.0% | 11.5% |
| Interquartile Range (IQR) | 9.7% | 5.7% |
| Standard Deviation (Sample) | 15.8% | 4.8% |
| Standard Deviation (Population) | 15.2% | 4.7% |
Similar Demographics by Child Poverty Among Girls Under 16
Demographics Similar to Immigrants from Turkey by Child Poverty Among Girls Under 16
In terms of child poverty among girls under 16, the demographic groups most similar to Immigrants from Turkey are Egyptian (14.7%, a difference of 0.0%), Tlingit-Haida (14.7%, a difference of 0.020%), Argentinean (14.7%, a difference of 0.020%), Immigrants from Russia (14.7%, a difference of 0.030%), and Immigrants from Eastern Europe (14.6%, a difference of 0.18%).
| Demographics | Rating | Rank | Child Poverty Among Girls Under 16 |
| Immigrants | Netherlands | 98.1 /100 | #72 | Exceptional 14.6% |
| Immigrants | Austria | 98.0 /100 | #73 | Exceptional 14.6% |
| Taiwanese | 98.0 /100 | #74 | Exceptional 14.6% |
| Immigrants | Eastern Europe | 98.0 /100 | #75 | Exceptional 14.6% |
| Immigrants | Russia | 97.9 /100 | #76 | Exceptional 14.7% |
| Tlingit-Haida | 97.9 /100 | #77 | Exceptional 14.7% |
| Argentineans | 97.9 /100 | #78 | Exceptional 14.7% |
| Immigrants | Turkey | 97.9 /100 | #79 | Exceptional 14.7% |
| Egyptians | 97.9 /100 | #80 | Exceptional 14.7% |
| Ukrainians | 97.7 /100 | #81 | Exceptional 14.7% |
| Macedonians | 97.6 /100 | #82 | Exceptional 14.7% |
| Immigrants | Italy | 97.4 /100 | #83 | Exceptional 14.8% |
| Soviet Union | 97.3 /100 | #84 | Exceptional 14.8% |
| Swiss | 97.2 /100 | #85 | Exceptional 14.8% |
| Australians | 97.2 /100 | #86 | Exceptional 14.8% |
Demographics Similar to Immigrants from Taiwan by Child Poverty Among Girls Under 16
In terms of child poverty among girls under 16, the demographic groups most similar to Immigrants from Taiwan are Filipino (11.4%, a difference of 0.87%), Tsimshian (11.5%, a difference of 1.4%), Immigrants from India (11.0%, a difference of 2.6%), Thai (11.8%, a difference of 4.5%), and Immigrants from Hong Kong (12.3%, a difference of 8.9%).
| Demographics | Rating | Rank | Child Poverty Among Girls Under 16 |
| Immigrants | India | 100.0 /100 | #1 | Exceptional 11.0% |
| Immigrants | Taiwan | 100.0 /100 | #2 | Exceptional 11.3% |
| Filipinos | 100.0 /100 | #3 | Exceptional 11.4% |
| Tsimshian | 100.0 /100 | #4 | Exceptional 11.5% |
| Thais | 100.0 /100 | #5 | Exceptional 11.8% |
| Immigrants | Hong Kong | 100.0 /100 | #6 | Exceptional 12.3% |
| Chinese | 100.0 /100 | #7 | Exceptional 12.3% |
| Iranians | 100.0 /100 | #8 | Exceptional 12.4% |
| Immigrants | Singapore | 100.0 /100 | #9 | Exceptional 12.5% |
| Immigrants | Iran | 100.0 /100 | #10 | Exceptional 12.6% |
| Immigrants | South Central Asia | 100.0 /100 | #11 | Exceptional 12.7% |
| Bhutanese | 100.0 /100 | #12 | Exceptional 12.7% |
| Immigrants | Ireland | 99.9 /100 | #13 | Exceptional 12.9% |
| Burmese | 99.9 /100 | #14 | Exceptional 13.0% |
| Okinawans | 99.9 /100 | #15 | Exceptional 13.0% |