Immigrants from Trinidad and Tobago vs Immigrants from Argentina Single Female Poverty
COMPARE
Immigrants from Trinidad and Tobago
Immigrants from Argentina
Single Female Poverty
Single Female Poverty Comparison
Immigrants from Trinidad and Tobago
Immigrants from Argentina
20.9%
SINGLE FEMALE POVERTY
56.3/ 100
METRIC RATING
169th/ 347
METRIC RANK
19.0%
SINGLE FEMALE POVERTY
99.8/ 100
METRIC RATING
48th/ 347
METRIC RANK
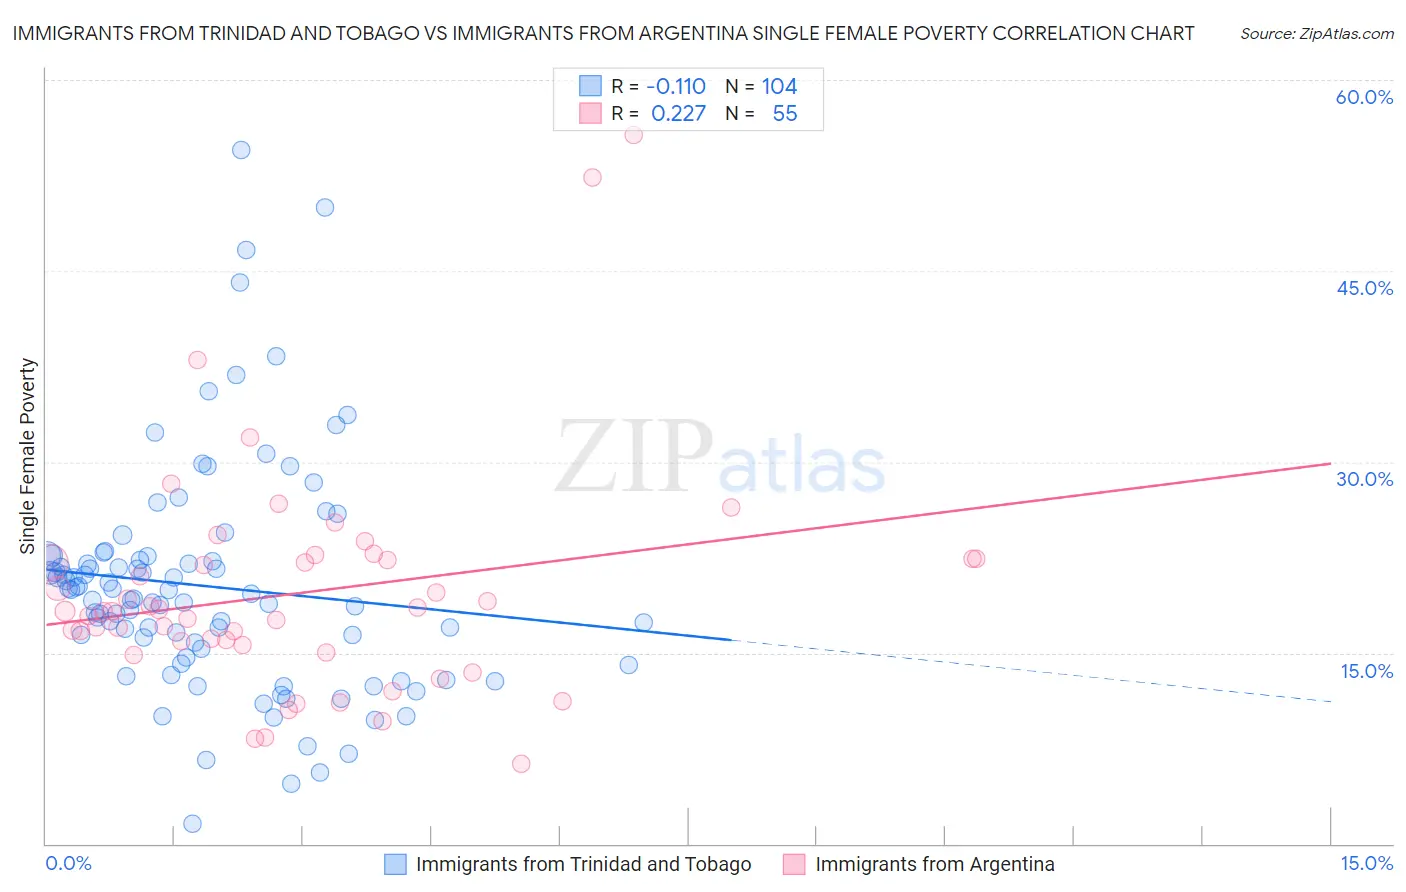
Immigrants from Trinidad and Tobago vs Immigrants from Argentina Single Female Poverty Correlation Chart
The statistical analysis conducted on geographies consisting of 221,570,063 people shows a poor negative correlation between the proportion of Immigrants from Trinidad and Tobago and poverty level among single females in the United States with a correlation coefficient (R) of -0.110 and weighted average of 20.9%. Similarly, the statistical analysis conducted on geographies consisting of 261,466,881 people shows a weak positive correlation between the proportion of Immigrants from Argentina and poverty level among single females in the United States with a correlation coefficient (R) of 0.227 and weighted average of 19.0%, a difference of 10.0%.
Single Female Poverty Correlation Summary
| Measurement | Immigrants from Trinidad and Tobago | Immigrants from Argentina |
| Minimum | 1.5% | 6.3% |
| Maximum | 54.5% | 55.7% |
| Range | 53.0% | 49.4% |
| Mean | 20.2% | 19.7% |
| Median | 19.4% | 18.2% |
| Interquartile 25% (IQ1) | 15.0% | 15.6% |
| Interquartile 75% (IQ3) | 22.4% | 22.4% |
| Interquartile Range (IQR) | 7.5% | 6.9% |
| Standard Deviation (Sample) | 8.9% | 8.9% |
| Standard Deviation (Population) | 8.9% | 8.8% |
Similar Demographics by Single Female Poverty
Demographics Similar to Immigrants from Trinidad and Tobago by Single Female Poverty
In terms of single female poverty, the demographic groups most similar to Immigrants from Trinidad and Tobago are New Zealander (21.0%, a difference of 0.20%), Moroccan (21.0%, a difference of 0.22%), Guyanese (21.0%, a difference of 0.27%), Immigrants from Costa Rica (20.9%, a difference of 0.34%), and Immigrants from Guyana (21.0%, a difference of 0.36%).
| Demographics | Rating | Rank | Single Female Poverty |
| Northern Europeans | 68.4 /100 | #162 | Good 20.8% |
| Lebanese | 67.6 /100 | #163 | Good 20.8% |
| Iraqis | 64.5 /100 | #164 | Good 20.8% |
| Ugandans | 64.0 /100 | #165 | Good 20.8% |
| Norwegians | 63.0 /100 | #166 | Good 20.8% |
| Immigrants | Norway | 63.0 /100 | #167 | Good 20.8% |
| Immigrants | Costa Rica | 61.5 /100 | #168 | Good 20.9% |
| Immigrants | Trinidad and Tobago | 56.3 /100 | #169 | Average 20.9% |
| New Zealanders | 53.2 /100 | #170 | Average 21.0% |
| Moroccans | 52.8 /100 | #171 | Average 21.0% |
| Guyanese | 52.0 /100 | #172 | Average 21.0% |
| Immigrants | Guyana | 50.6 /100 | #173 | Average 21.0% |
| Cubans | 50.0 /100 | #174 | Average 21.0% |
| Czechs | 46.8 /100 | #175 | Average 21.0% |
| Canadians | 45.4 /100 | #176 | Average 21.1% |
Demographics Similar to Immigrants from Argentina by Single Female Poverty
In terms of single female poverty, the demographic groups most similar to Immigrants from Argentina are Immigrants from Czechoslovakia (19.0%, a difference of 0.010%), Immigrants from Eastern Europe (19.0%, a difference of 0.050%), Immigrants from Italy (19.0%, a difference of 0.090%), Egyptian (19.1%, a difference of 0.13%), and Latvian (19.0%, a difference of 0.28%).
| Demographics | Rating | Rank | Single Female Poverty |
| Immigrants | Serbia | 99.9 /100 | #41 | Exceptional 18.8% |
| Jordanians | 99.9 /100 | #42 | Exceptional 18.8% |
| Immigrants | Romania | 99.9 /100 | #43 | Exceptional 18.8% |
| Immigrants | Croatia | 99.9 /100 | #44 | Exceptional 18.9% |
| Immigrants | Indonesia | 99.8 /100 | #45 | Exceptional 18.9% |
| Macedonians | 99.8 /100 | #46 | Exceptional 18.9% |
| Latvians | 99.8 /100 | #47 | Exceptional 19.0% |
| Immigrants | Argentina | 99.8 /100 | #48 | Exceptional 19.0% |
| Immigrants | Czechoslovakia | 99.8 /100 | #49 | Exceptional 19.0% |
| Immigrants | Eastern Europe | 99.8 /100 | #50 | Exceptional 19.0% |
| Immigrants | Italy | 99.8 /100 | #51 | Exceptional 19.0% |
| Egyptians | 99.7 /100 | #52 | Exceptional 19.1% |
| Tsimshian | 99.7 /100 | #53 | Exceptional 19.1% |
| Argentineans | 99.7 /100 | #54 | Exceptional 19.1% |
| Immigrants | Vietnam | 99.7 /100 | #55 | Exceptional 19.1% |