Immigrants from Taiwan vs Immigrants from Lebanon Child Poverty Among Girls Under 16
COMPARE
Immigrants from Taiwan
Immigrants from Lebanon
Child Poverty Among Girls Under 16
Child Poverty Among Girls Under 16 Comparison
Immigrants from Taiwan
Immigrants from Lebanon
11.3%
CHILD POVERTY AMONG GIRLS UNDER 16
100.0/ 100
METRIC RATING
2nd/ 347
METRIC RANK
17.1%
CHILD POVERTY AMONG GIRLS UNDER 16
22.6/ 100
METRIC RATING
198th/ 347
METRIC RANK
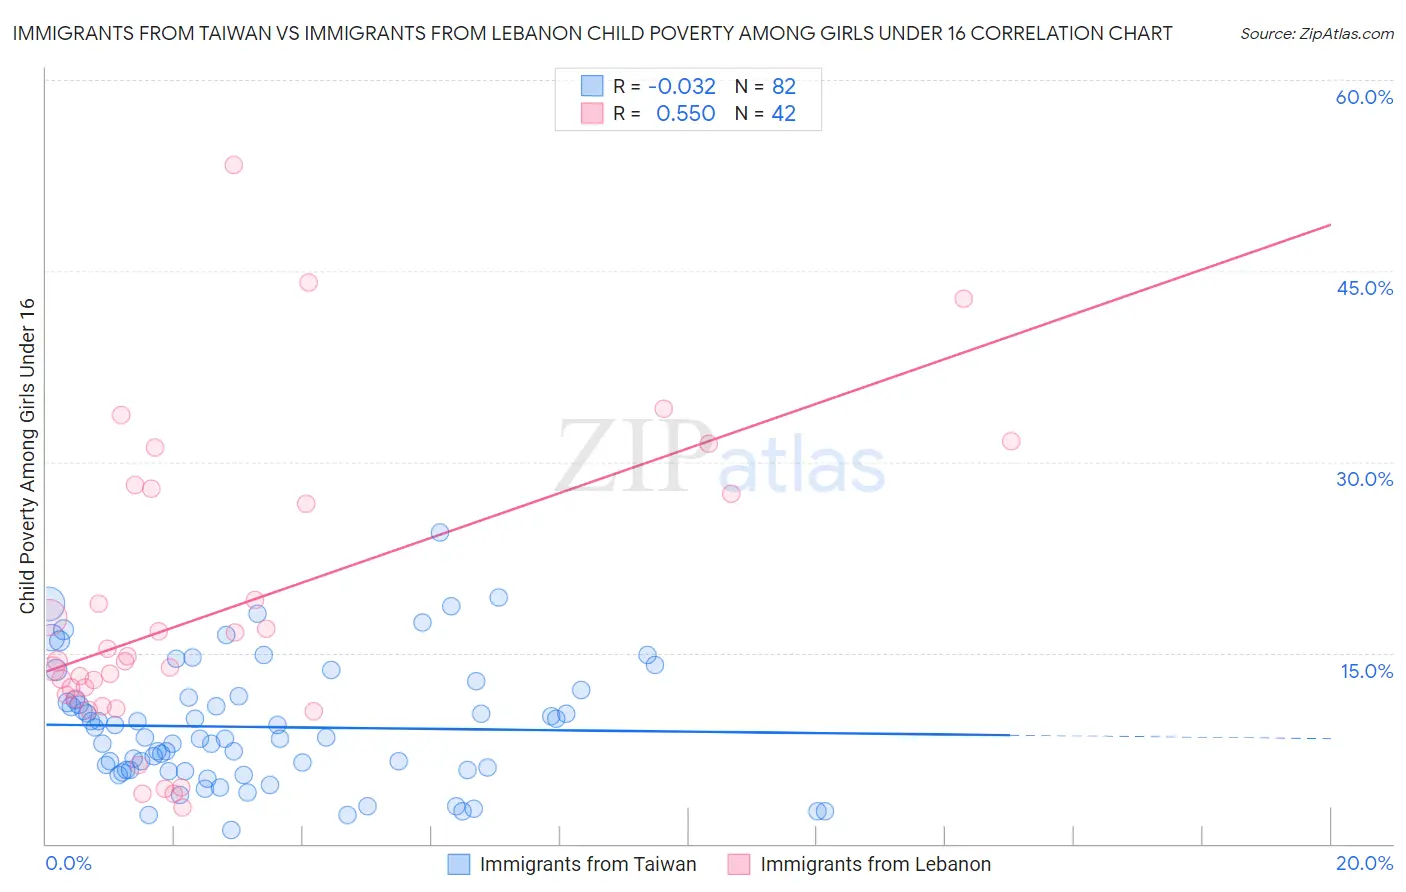
Immigrants from Taiwan vs Immigrants from Lebanon Child Poverty Among Girls Under 16 Correlation Chart
The statistical analysis conducted on geographies consisting of 293,199,111 people shows no correlation between the proportion of Immigrants from Taiwan and poverty level among girls under the age of 16 in the United States with a correlation coefficient (R) of -0.032 and weighted average of 11.3%. Similarly, the statistical analysis conducted on geographies consisting of 214,720,358 people shows a substantial positive correlation between the proportion of Immigrants from Lebanon and poverty level among girls under the age of 16 in the United States with a correlation coefficient (R) of 0.550 and weighted average of 17.1%, a difference of 50.7%.
Child Poverty Among Girls Under 16 Correlation Summary
| Measurement | Immigrants from Taiwan | Immigrants from Lebanon |
| Minimum | 1.1% | 2.9% |
| Maximum | 24.4% | 53.3% |
| Range | 23.4% | 50.5% |
| Mean | 9.2% | 18.4% |
| Median | 8.3% | 14.3% |
| Interquartile 25% (IQ1) | 5.8% | 11.4% |
| Interquartile 75% (IQ3) | 11.5% | 27.5% |
| Interquartile Range (IQR) | 5.7% | 16.1% |
| Standard Deviation (Sample) | 4.8% | 11.7% |
| Standard Deviation (Population) | 4.7% | 11.6% |
Similar Demographics by Child Poverty Among Girls Under 16
Demographics Similar to Immigrants from Taiwan by Child Poverty Among Girls Under 16
In terms of child poverty among girls under 16, the demographic groups most similar to Immigrants from Taiwan are Filipino (11.4%, a difference of 0.87%), Tsimshian (11.5%, a difference of 1.4%), Immigrants from India (11.0%, a difference of 2.6%), Thai (11.8%, a difference of 4.5%), and Immigrants from Hong Kong (12.3%, a difference of 8.9%).
| Demographics | Rating | Rank | Child Poverty Among Girls Under 16 |
| Immigrants | India | 100.0 /100 | #1 | Exceptional 11.0% |
| Immigrants | Taiwan | 100.0 /100 | #2 | Exceptional 11.3% |
| Filipinos | 100.0 /100 | #3 | Exceptional 11.4% |
| Tsimshian | 100.0 /100 | #4 | Exceptional 11.5% |
| Thais | 100.0 /100 | #5 | Exceptional 11.8% |
| Immigrants | Hong Kong | 100.0 /100 | #6 | Exceptional 12.3% |
| Chinese | 100.0 /100 | #7 | Exceptional 12.3% |
| Iranians | 100.0 /100 | #8 | Exceptional 12.4% |
| Immigrants | Singapore | 100.0 /100 | #9 | Exceptional 12.5% |
| Immigrants | Iran | 100.0 /100 | #10 | Exceptional 12.6% |
| Immigrants | South Central Asia | 100.0 /100 | #11 | Exceptional 12.7% |
| Bhutanese | 100.0 /100 | #12 | Exceptional 12.7% |
| Immigrants | Ireland | 99.9 /100 | #13 | Exceptional 12.9% |
| Burmese | 99.9 /100 | #14 | Exceptional 13.0% |
| Okinawans | 99.9 /100 | #15 | Exceptional 13.0% |
Demographics Similar to Immigrants from Lebanon by Child Poverty Among Girls Under 16
In terms of child poverty among girls under 16, the demographic groups most similar to Immigrants from Lebanon are Immigrants from Afghanistan (17.1%, a difference of 0.020%), Immigrants from Uzbekistan (17.1%, a difference of 0.18%), Spaniard (17.0%, a difference of 0.35%), Celtic (17.0%, a difference of 0.41%), and Immigrants from Costa Rica (17.0%, a difference of 0.46%).
| Demographics | Rating | Rank | Child Poverty Among Girls Under 16 |
| Immigrants | Azores | 31.3 /100 | #191 | Fair 16.8% |
| Immigrants | Uganda | 31.3 /100 | #192 | Fair 16.8% |
| Aleuts | 28.7 /100 | #193 | Fair 16.9% |
| Spanish | 28.6 /100 | #194 | Fair 16.9% |
| Immigrants | Costa Rica | 25.6 /100 | #195 | Fair 17.0% |
| Celtics | 25.2 /100 | #196 | Fair 17.0% |
| Spaniards | 24.9 /100 | #197 | Fair 17.0% |
| Immigrants | Lebanon | 22.6 /100 | #198 | Fair 17.1% |
| Immigrants | Afghanistan | 22.4 /100 | #199 | Fair 17.1% |
| Immigrants | Uzbekistan | 21.5 /100 | #200 | Fair 17.1% |
| Immigrants | Kenya | 17.8 /100 | #201 | Poor 17.2% |
| Immigrants | Sierra Leone | 17.6 /100 | #202 | Poor 17.2% |
| Ugandans | 17.5 /100 | #203 | Poor 17.2% |
| Iraqis | 13.0 /100 | #204 | Poor 17.4% |
| Immigrants | Cameroon | 12.6 /100 | #205 | Poor 17.4% |