Immigrants from Syria vs Samoan Receiving Food Stamps
COMPARE
Immigrants from Syria
Samoan
Receiving Food Stamps
Receiving Food Stamps Comparison
Immigrants from Syria
Samoans
11.7%
RECEIVING FOOD STAMPS
53.4/ 100
METRIC RATING
173rd/ 347
METRIC RANK
12.1%
RECEIVING FOOD STAMPS
31.0/ 100
METRIC RATING
192nd/ 347
METRIC RANK
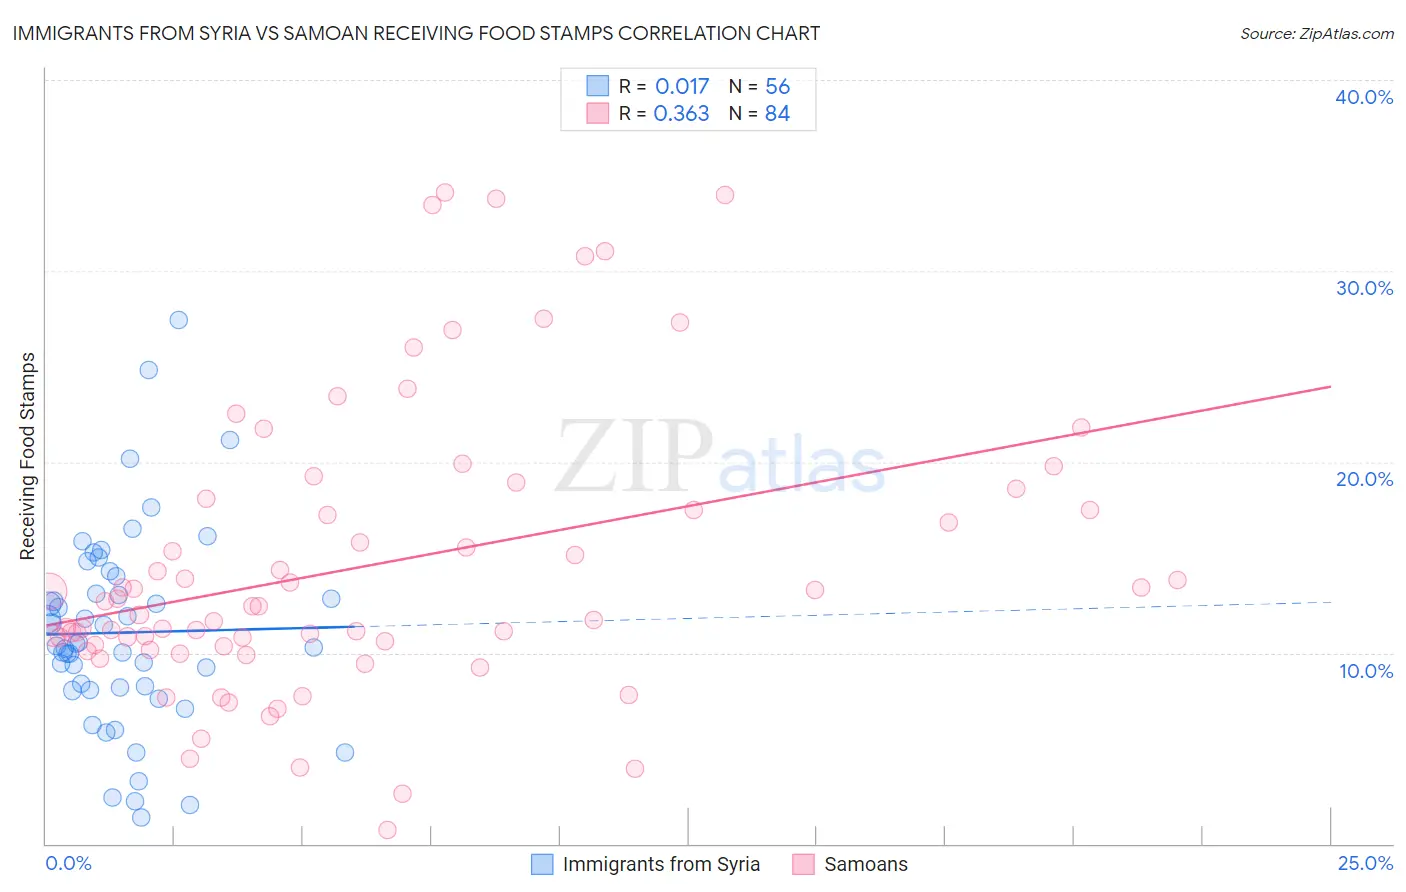
Immigrants from Syria vs Samoan Receiving Food Stamps Correlation Chart
The statistical analysis conducted on geographies consisting of 173,879,685 people shows no correlation between the proportion of Immigrants from Syria and percentage of population receiving government assistance and/or food stamps in the United States with a correlation coefficient (R) of 0.017 and weighted average of 11.7%. Similarly, the statistical analysis conducted on geographies consisting of 224,983,999 people shows a mild positive correlation between the proportion of Samoans and percentage of population receiving government assistance and/or food stamps in the United States with a correlation coefficient (R) of 0.363 and weighted average of 12.1%, a difference of 3.3%.
Receiving Food Stamps Correlation Summary
| Measurement | Immigrants from Syria | Samoan |
| Minimum | 1.4% | 0.70% |
| Maximum | 27.4% | 34.1% |
| Range | 26.0% | 33.4% |
| Mean | 11.1% | 14.6% |
| Median | 10.4% | 12.4% |
| Interquartile 25% (IQ1) | 8.1% | 10.4% |
| Interquartile 75% (IQ3) | 13.5% | 17.8% |
| Interquartile Range (IQR) | 5.5% | 7.4% |
| Standard Deviation (Sample) | 5.2% | 7.5% |
| Standard Deviation (Population) | 5.2% | 7.5% |
Demographics Similar to Immigrants from Syria and Samoans by Receiving Food Stamps
In terms of receiving food stamps, the demographic groups most similar to Immigrants from Syria are Guamanian/Chamorro (11.7%, a difference of 0.11%), Immigrants from Eritrea (11.7%, a difference of 0.48%), Osage (11.7%, a difference of 0.51%), Peruvian (11.7%, a difference of 0.58%), and Immigrants from Ukraine (11.8%, a difference of 0.71%). Similarly, the demographic groups most similar to Samoans are Venezuelan (12.0%, a difference of 0.18%), Immigrants from Peru (12.0%, a difference of 0.19%), Immigrants from Cameroon (12.0%, a difference of 0.24%), Sudanese (12.0%, a difference of 0.38%), and Albanian (12.0%, a difference of 0.69%).
| Demographics | Rating | Rank | Receiving Food Stamps |
| Guamanians/Chamorros | 54.2 /100 | #172 | Average 11.7% |
| Immigrants | Syria | 53.4 /100 | #173 | Average 11.7% |
| Immigrants | Eritrea | 50.0 /100 | #174 | Average 11.7% |
| Osage | 49.8 /100 | #175 | Average 11.7% |
| Peruvians | 49.3 /100 | #176 | Average 11.7% |
| Immigrants | Ukraine | 48.4 /100 | #177 | Average 11.8% |
| German Russians | 48.1 /100 | #178 | Average 11.8% |
| Immigrants | Kenya | 46.4 /100 | #179 | Average 11.8% |
| Uruguayans | 44.8 /100 | #180 | Average 11.8% |
| South American Indians | 41.7 /100 | #181 | Average 11.9% |
| Immigrants | Morocco | 40.7 /100 | #182 | Average 11.9% |
| Immigrants | Uganda | 40.3 /100 | #183 | Average 11.9% |
| Spaniards | 39.8 /100 | #184 | Fair 11.9% |
| Immigrants | Iraq | 37.1 /100 | #185 | Fair 12.0% |
| Spanish | 36.9 /100 | #186 | Fair 12.0% |
| Albanians | 35.4 /100 | #187 | Fair 12.0% |
| Sudanese | 33.4 /100 | #188 | Fair 12.0% |
| Immigrants | Cameroon | 32.5 /100 | #189 | Fair 12.0% |
| Immigrants | Peru | 32.2 /100 | #190 | Fair 12.0% |
| Venezuelans | 32.1 /100 | #191 | Fair 12.0% |
| Samoans | 31.0 /100 | #192 | Fair 12.1% |