Immigrants from Syria vs Hungarian Single Mother Poverty

COMPARE

Immigrants from Syria
Race
Ancestry
AfghanAfricanAlaska NativeAlaskan AthabascanAlbanianAleutAlsatianAmericanApacheArabArapahoArgentineanArmenianAssyrian/Chaldean/SyriacAustralianAustrianBahamianBangladeshiBarbadianBasqueBelgianBelizeanBermudanBhutaneseBlackfeetBolivianBrazilianBritishBritish West IndianBulgarianBurmeseCajunCambodianCanadianCape VerdeanCarpatho RusynCelticCentral AmericanCentral American IndianCherokeeCheyenneChickasawChileanChineseChippewaChoctawColombianColvilleComancheCosta RicanCreeCreekCroatianCrowCubanCypriotCzechCzechoslovakianDanishDelawareDominicanDutchDutch West IndianEastern EuropeanEcuadorianEgyptianEnglishEstonianEthiopianEuropeanFijianFilipinoFinnishFrenchFrench American IndianFrench CanadianGermanGerman RussianGhanaianGreekGuamanian/ChamorroGuatemalanGuyaneseHaitianHmongHonduranHopiHoumaIcelanderIndian (Asian)IndonesianInupiatIranianIraqiIrishIroquoisIsraeliItalianJamaicanJapaneseJordanianKenyanKiowaKoreanLaotianLatvianLebaneseLiberianLithuanianLumbeeLuxembourgerMacedonianMalaysianMalteseMarshalleseMenomineeMexicanMexican American IndianMongolianMoroccanNative HawaiianNavajoNepaleseNew ZealanderNicaraguanNigerianNorthern EuropeanNorwegianOkinawanOsageOttawaPaiutePakistaniPalestinianPanamanianParaguayanPennsylvania GermanPeruvianPimaPolishPortuguesePotawatomiPuebloPuerto RicanPuget Sound SalishRomanianRussianSalvadoranSamoanScandinavianScotch-IrishScottishSeminoleSenegaleseSerbianShoshoneSierra LeoneanSiouxSlavicSlovakSloveneSomaliSouth AfricanSouth AmericanSouth American IndianSoviet UnionSpaniardSpanishSpanish AmericanSpanish American IndianSri LankanSubsaharan AfricanSudaneseSwedishSwissSyrianTaiwaneseThaiTlingit-HaidaTohono O'OdhamTonganTrinidadian and TobagonianTsimshianTurkishU.S. Virgin IslanderUgandanUkrainianUruguayanUteVenezuelanVietnameseWelshWest IndianYakamaYaquiYugoslavianYumanYup'ikZimbabwean
Immigration
NonimmigrantsImmigrantsAfghanistanAfricaAlbaniaArgentinaArmeniaAsiaAustraliaAustriaBahamasBangladeshBarbadosBelarusBelgiumBelizeBoliviaBosnia and HerzegovinaBrazilBulgariaBurma/MyanmarCabo VerdeCambodiaCameroonCanadaCaribbeanCentral AmericaChileChinaColombiaCongoCosta RicaCroatiaCubaCzechoslovakiaDenmarkDominicaDominican RepublicEastern AfricaEastern AsiaEastern EuropeEcuadorEgyptEl SalvadorEnglandEritreaEthiopiaEuropeFijiFranceGermanyGhanaGreeceGrenadaGuatemalaGuyanaHaitiHondurasHong KongHungaryIndiaIndonesiaIranIraqIrelandIsraelItalyJamaicaJapanJordanKazakhstanKenyaKoreaKuwaitLaosLatin AmericaLatviaLebanonLiberiaLithuaniaMalaysiaMexicoMicronesiaMiddle AfricaMoldovaMoroccoNepalNetherlandsNicaraguaNigeriaNorth AmericaNorth MacedoniaNorthern AfricaNorthern EuropeNorwayOceaniaPakistanPanamaPeruPhilippinesPolandPortugalRomaniaRussiaSaudi ArabiaScotlandSenegalSerbiaSierra LeoneSingaporeSomaliaSouth AfricaSouth AmericaSouth Central AsiaSouth Eastern AsiaSouthern EuropeSpainSri LankaSt. Vincent and the GrenadinesSudanSwedenSwitzerlandSyriaTaiwanThailandTrinidad and TobagoTurkeyUgandaUkraineUruguayUzbekistanVenezuelaVietnamWest IndiesWestern AfricaWestern AsiaWestern EuropeYemenZaireZimbabweAzores
Hungarian
Race
Ancestry
AfghanAfricanAlaska NativeAlaskan AthabascanAlbanianAleutAlsatianAmericanApacheArabArapahoArgentineanArmenianAssyrian/Chaldean/SyriacAustralianAustrianBahamianBangladeshiBarbadianBasqueBelgianBelizeanBermudanBhutaneseBlackfeetBolivianBrazilianBritishBritish West IndianBulgarianBurmeseCajunCambodianCanadianCape VerdeanCarpatho RusynCelticCentral AmericanCentral American IndianCherokeeCheyenneChickasawChileanChineseChippewaChoctawColombianColvilleComancheCosta RicanCreeCreekCroatianCrowCubanCypriotCzechCzechoslovakianDanishDelawareDominicanDutchDutch West IndianEastern EuropeanEcuadorianEgyptianEnglishEstonianEthiopianEuropeanFijianFilipinoFinnishFrenchFrench American IndianFrench CanadianGermanGerman RussianGhanaianGreekGuamanian/ChamorroGuatemalanGuyaneseHaitianHmongHonduranHopiHoumaHungarianIcelanderIndian (Asian)IndonesianInupiatIranianIraqiIrishIroquoisIsraeliItalianJamaicanJapaneseJordanianKenyanKiowaKoreanLaotianLatvianLebaneseLiberianLithuanianLumbeeLuxembourgerMacedonianMalaysianMalteseMarshalleseMenomineeMexicanMexican American IndianMongolianMoroccanNative HawaiianNavajoNepaleseNew ZealanderNicaraguanNigerianNorthern EuropeanNorwegianOkinawanOsageOttawaPaiutePakistaniPalestinianPanamanianParaguayanPennsylvania GermanPeruvianPimaPolishPortuguesePotawatomiPuebloPuerto RicanPuget Sound SalishRomanianRussianSalvadoranSamoanScandinavianScotch-IrishScottishSeminoleSenegaleseSerbianShoshoneSierra LeoneanSiouxSlavicSlovakSloveneSomaliSouth AfricanSouth AmericanSouth American IndianSoviet UnionSpaniardSpanishSpanish AmericanSpanish American IndianSri LankanSubsaharan AfricanSudaneseSwedishSwissSyrianTaiwaneseThaiTlingit-HaidaTohono O'OdhamTonganTrinidadian and TobagonianTsimshianTurkishU.S. Virgin IslanderUgandanUkrainianUruguayanUteVenezuelanVietnameseWelshWest IndianYakamaYaquiYugoslavianYumanYup'ikZimbabwean
Immigration
NonimmigrantsImmigrantsAfghanistanAfricaAlbaniaArgentinaArmeniaAsiaAustraliaAustriaBahamasBangladeshBarbadosBelarusBelgiumBelizeBoliviaBosnia and HerzegovinaBrazilBulgariaBurma/MyanmarCabo VerdeCambodiaCameroonCanadaCaribbeanCentral AmericaChileChinaColombiaCongoCosta RicaCroatiaCubaCzechoslovakiaDenmarkDominicaDominican RepublicEastern AfricaEastern AsiaEastern EuropeEcuadorEgyptEl SalvadorEnglandEritreaEthiopiaEuropeFijiFranceGermanyGhanaGreeceGrenadaGuatemalaGuyanaHaitiHondurasHong KongHungaryIndiaIndonesiaIranIraqIrelandIsraelItalyJamaicaJapanJordanKazakhstanKenyaKoreaKuwaitLaosLatin AmericaLatviaLebanonLiberiaLithuaniaMalaysiaMexicoMicronesiaMiddle AfricaMoldovaMoroccoNepalNetherlandsNicaraguaNigeriaNorth AmericaNorth MacedoniaNorthern AfricaNorthern EuropeNorwayOceaniaPakistanPanamaPeruPhilippinesPolandPortugalRomaniaRussiaSaudi ArabiaScotlandSenegalSerbiaSierra LeoneSingaporeSomaliaSouth AfricaSouth AmericaSouth Central AsiaSouth Eastern AsiaSouthern EuropeSpainSri LankaSt. Vincent and the GrenadinesSudanSwedenSwitzerlandTaiwanThailandTrinidad and TobagoTurkeyUgandaUkraineUruguayUzbekistanVenezuelaVietnamWest IndiesWestern AfricaWestern AsiaWestern EuropeYemenZaireZimbabweAzores
Single Mother Poverty
Income
Poverty
Unemployment
Labor Participation
Family Structure
Vehicle Availability
Education Level
Disability

Single Mother Poverty Comparison

Immigrants from Syria

Hungarians

Exceptional
Poor
28.3%
SINGLE MOTHER POVERTY
92.4/ 100
METRIC RATING
119th/ 347
METRIC RANK
29.9%
SINGLE MOTHER POVERTY
10.3/ 100
METRIC RATING
218th/ 347
METRIC RANK

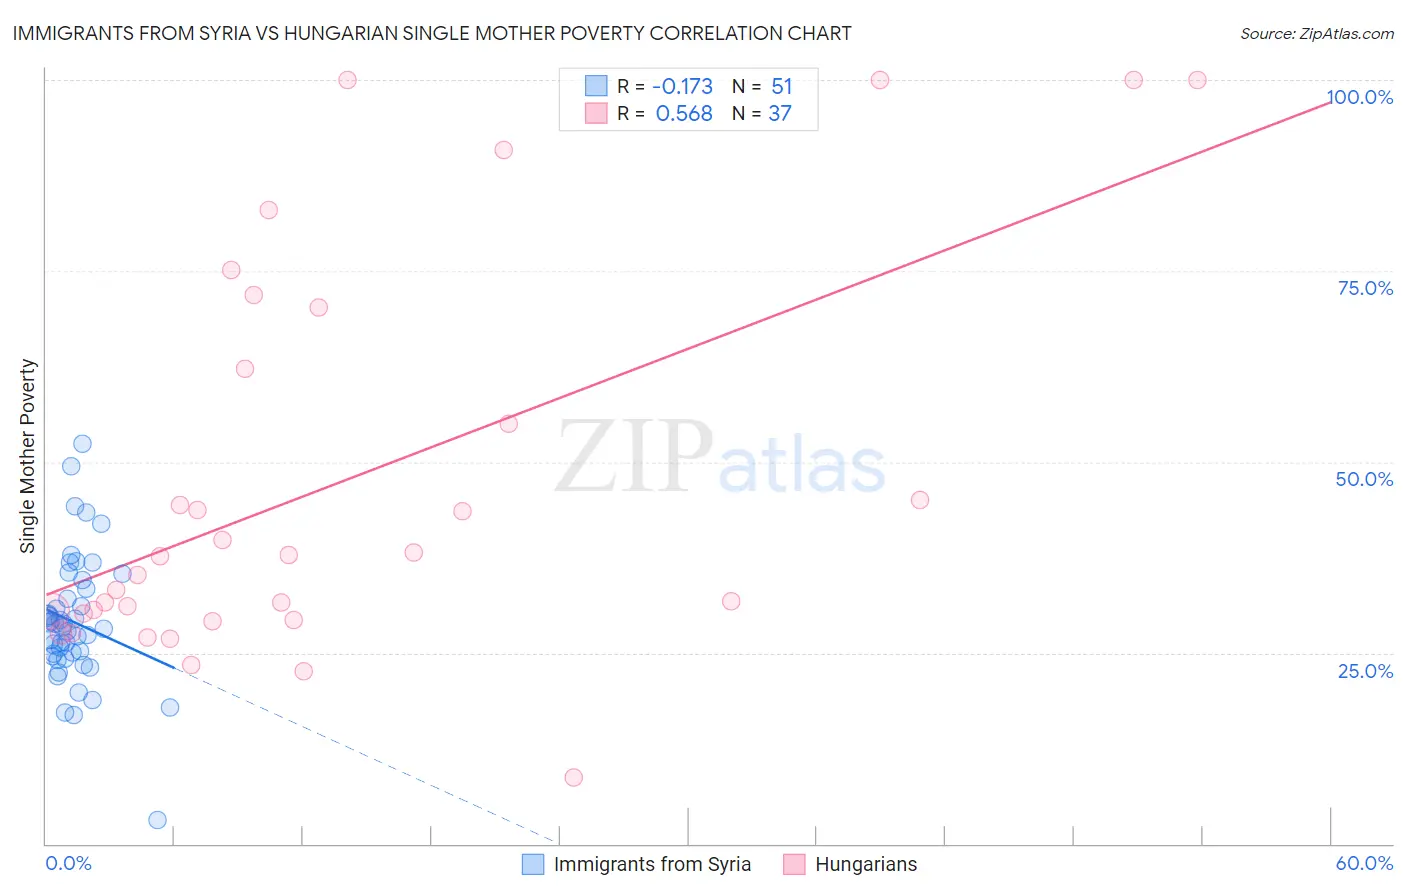
Immigrants from Syria vs Hungarian Single Mother Poverty Correlation Chart

The statistical analysis conducted on geographies consisting of 172,226,665 people shows a poor negative correlation between the proportion of Immigrants from Syria and poverty level among single mothers in the United States with a correlation coefficient (R) of -0.173 and weighted average of 28.3%. Similarly, the statistical analysis conducted on geographies consisting of 467,495,531 people shows a substantial positive correlation between the proportion of Hungarians and poverty level among single mothers in the United States with a correlation coefficient (R) of 0.568 and weighted average of 29.9%, a difference of 5.7%.
Immigrants from Syria vs Hungarian Single Mother Poverty

Single Mother Poverty Correlation Summary

MeasurementImmigrants from SyriaHungarian
Minimum3.1%8.6%
Maximum52.4%100.0%
Range49.3%91.4%
Mean29.0%47.2%
Median28.3%37.6%
Interquartile 25% (IQ1)24.5%29.7%
Interquartile 75% (IQ3)33.3%66.3%
Interquartile Range (IQR)8.8%36.6%
Standard Deviation (Sample)8.5%25.8%
Standard Deviation (Population)8.4%25.5%

Similar Demographics by Single Mother Poverty

Demographics Similar to Immigrants from Syria by Single Mother Poverty

In terms of single mother poverty, the demographic groups most similar to Immigrants from Syria are Brazilian (28.3%, a difference of 0.010%), Australian (28.3%, a difference of 0.020%), Cypriot (28.3%, a difference of 0.020%), Immigrants from Uganda (28.3%, a difference of 0.030%), and Immigrants from Kuwait (28.3%, a difference of 0.050%).
DemographicsRating | RankSingle Mother Poverty
Immigrants | Kazakhstan
94.5
/100
|
#112
Exceptional
28.2%
Immigrants | South Africa
93.2
/100
|
#113
Exceptional
28.3%
Immigrants | Western Asia
92.7
/100
|
#114
Exceptional
28.3%
Immigrants | Kuwait
92.7
/100
|
#115
Exceptional
28.3%
Immigrants | Uganda
92.5
/100
|
#116
Exceptional
28.3%
Australians
92.5
/100
|
#117
Exceptional
28.3%
Brazilians
92.4
/100
|
#118
Exceptional
28.3%
Immigrants | Syria
92.4
/100
|
#119
Exceptional
28.3%
Cypriots
92.3
/100
|
#120
Exceptional
28.3%
Immigrants | Afghanistan
92.1
/100
|
#121
Exceptional
28.3%
Colombians
91.8
/100
|
#122
Exceptional
28.3%
Uruguayans
91.7
/100
|
#123
Exceptional
28.3%
Immigrants | Switzerland
91.7
/100
|
#124
Exceptional
28.3%
Kenyans
90.9
/100
|
#125
Exceptional
28.4%
Immigrants | Chile
90.8
/100
|
#126
Exceptional
28.4%

Demographics Similar to Hungarians by Single Mother Poverty

In terms of single mother poverty, the demographic groups most similar to Hungarians are Immigrants from Ghana (29.9%, a difference of 0.12%), Immigrants from Western Africa (29.9%, a difference of 0.14%), Finnish (30.0%, a difference of 0.14%), Liberian (29.9%, a difference of 0.16%), and Jamaican (29.9%, a difference of 0.16%).
DemographicsRating | RankSingle Mother Poverty
Guyanese
12.8
/100
|
#211
Poor
29.8%
Nicaraguans
12.4
/100
|
#212
Poor
29.8%
Immigrants | Thailand
12.0
/100
|
#213
Poor
29.9%
Liberians
11.7
/100
|
#214
Poor
29.9%
Jamaicans
11.7
/100
|
#215
Poor
29.9%
Immigrants | Western Africa
11.5
/100
|
#216
Poor
29.9%
Immigrants | Ghana
11.3
/100
|
#217
Poor
29.9%
Hungarians
10.3
/100
|
#218
Poor
29.9%
Finns
9.3
/100
|
#219
Tragic
30.0%
Germans
8.8
/100
|
#220
Tragic
30.0%
Immigrants | Eritrea
7.7
/100
|
#221
Tragic
30.0%
Sudanese
7.6
/100
|
#222
Tragic
30.0%
Immigrants | Cuba
6.9
/100
|
#223
Tragic
30.1%
Immigrants | Sudan
6.5
/100
|
#224
Tragic
30.1%
Spanish
6.3
/100
|
#225
Tragic
30.1%