Immigrants from Switzerland vs Immigrants from Uzbekistan Poverty
COMPARE
Immigrants from Switzerland
Immigrants from Uzbekistan
Poverty
Poverty Comparison
Immigrants from Switzerland
Immigrants from Uzbekistan
11.8%
POVERTY
83.0/ 100
METRIC RATING
137th/ 347
METRIC RANK
13.3%
POVERTY
3.2/ 100
METRIC RATING
217th/ 347
METRIC RANK
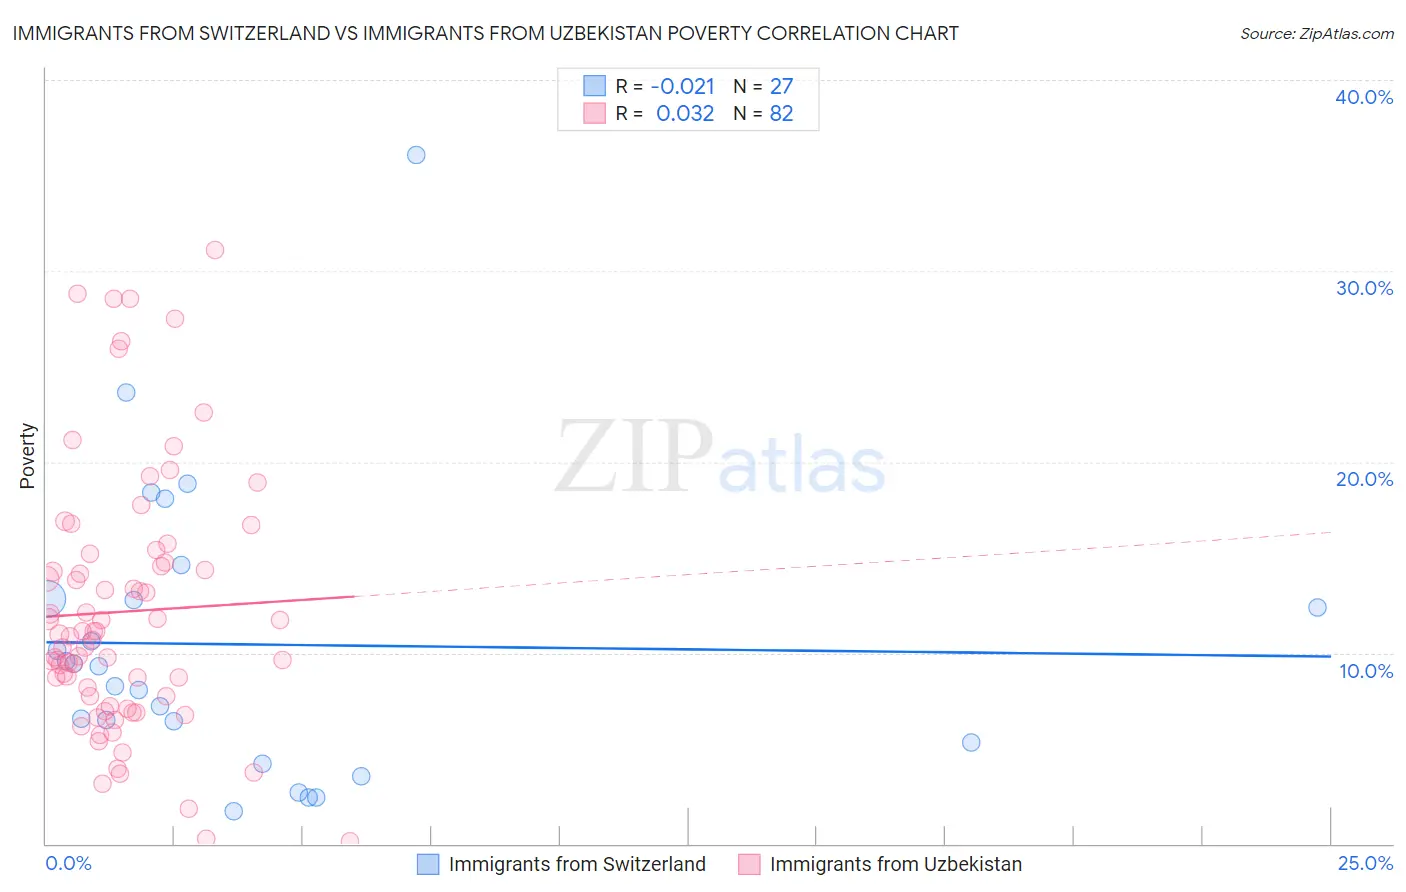
Immigrants from Switzerland vs Immigrants from Uzbekistan Poverty Correlation Chart
The statistical analysis conducted on geographies consisting of 148,064,410 people shows no correlation between the proportion of Immigrants from Switzerland and poverty level in the United States with a correlation coefficient (R) of -0.021 and weighted average of 11.8%. Similarly, the statistical analysis conducted on geographies consisting of 118,719,831 people shows no correlation between the proportion of Immigrants from Uzbekistan and poverty level in the United States with a correlation coefficient (R) of 0.032 and weighted average of 13.3%, a difference of 12.6%.
Poverty Correlation Summary
| Measurement | Immigrants from Switzerland | Immigrants from Uzbekistan |
| Minimum | 1.7% | 0.14% |
| Maximum | 36.1% | 31.1% |
| Range | 34.3% | 30.9% |
| Mean | 10.4% | 12.2% |
| Median | 9.3% | 10.9% |
| Interquartile 25% (IQ1) | 5.3% | 7.7% |
| Interquartile 75% (IQ3) | 12.8% | 14.7% |
| Interquartile Range (IQR) | 7.6% | 7.0% |
| Standard Deviation (Sample) | 7.6% | 6.7% |
| Standard Deviation (Population) | 7.5% | 6.7% |
Similar Demographics by Poverty
Demographics Similar to Immigrants from Switzerland by Poverty
In terms of poverty, the demographic groups most similar to Immigrants from Switzerland are Immigrants from Jordan (11.9%, a difference of 0.11%), Pakistani (11.9%, a difference of 0.14%), Chilean (11.8%, a difference of 0.21%), Immigrants from Peru (11.9%, a difference of 0.33%), and Immigrants from Vietnam (11.8%, a difference of 0.41%).
| Demographics | Rating | Rank | Poverty |
| Immigrants | Ukraine | 86.6 /100 | #130 | Excellent 11.8% |
| French | 86.1 /100 | #131 | Excellent 11.8% |
| Peruvians | 85.6 /100 | #132 | Excellent 11.8% |
| Immigrants | Western Europe | 85.2 /100 | #133 | Excellent 11.8% |
| Yugoslavians | 85.2 /100 | #134 | Excellent 11.8% |
| Immigrants | Vietnam | 85.2 /100 | #135 | Excellent 11.8% |
| Chileans | 84.2 /100 | #136 | Excellent 11.8% |
| Immigrants | Switzerland | 83.0 /100 | #137 | Excellent 11.8% |
| Immigrants | Jordan | 82.4 /100 | #138 | Excellent 11.9% |
| Pakistanis | 82.2 /100 | #139 | Excellent 11.9% |
| Immigrants | Peru | 81.1 /100 | #140 | Excellent 11.9% |
| Immigrants | France | 80.5 /100 | #141 | Excellent 11.9% |
| Basques | 80.4 /100 | #142 | Excellent 11.9% |
| Brazilians | 79.7 /100 | #143 | Good 11.9% |
| Icelanders | 77.9 /100 | #144 | Good 11.9% |
Demographics Similar to Immigrants from Uzbekistan by Poverty
In terms of poverty, the demographic groups most similar to Immigrants from Uzbekistan are Japanese (13.3%, a difference of 0.040%), Nonimmigrants (13.3%, a difference of 0.040%), Immigrants from Thailand (13.3%, a difference of 0.060%), Immigrants from Cambodia (13.4%, a difference of 0.19%), and American (13.4%, a difference of 0.28%).
| Demographics | Rating | Rank | Poverty |
| Immigrants | Azores | 6.1 /100 | #210 | Tragic 13.1% |
| Moroccans | 5.2 /100 | #211 | Tragic 13.2% |
| Immigrants | Immigrants | 4.3 /100 | #212 | Tragic 13.2% |
| Immigrants | Panama | 4.1 /100 | #213 | Tragic 13.3% |
| Bermudans | 3.7 /100 | #214 | Tragic 13.3% |
| Japanese | 3.3 /100 | #215 | Tragic 13.3% |
| Immigrants | Nonimmigrants | 3.3 /100 | #216 | Tragic 13.3% |
| Immigrants | Uzbekistan | 3.2 /100 | #217 | Tragic 13.3% |
| Immigrants | Thailand | 3.1 /100 | #218 | Tragic 13.3% |
| Immigrants | Cambodia | 3.0 /100 | #219 | Tragic 13.4% |
| Americans | 2.9 /100 | #220 | Tragic 13.4% |
| Alsatians | 2.6 /100 | #221 | Tragic 13.4% |
| Immigrants | Micronesia | 2.6 /100 | #222 | Tragic 13.4% |
| Immigrants | Africa | 2.5 /100 | #223 | Tragic 13.4% |
| Immigrants | Eritrea | 2.4 /100 | #224 | Tragic 13.4% |