Immigrants from Sudan vs Immigrants from Ghana Single Mother Poverty
COMPARE
Immigrants from Sudan
Immigrants from Ghana
Single Mother Poverty
Single Mother Poverty Comparison
Immigrants from Sudan
Immigrants from Ghana
30.1%
SINGLE MOTHER POVERTY
6.5/ 100
METRIC RATING
224th/ 347
METRIC RANK
29.9%
SINGLE MOTHER POVERTY
11.3/ 100
METRIC RATING
217th/ 347
METRIC RANK
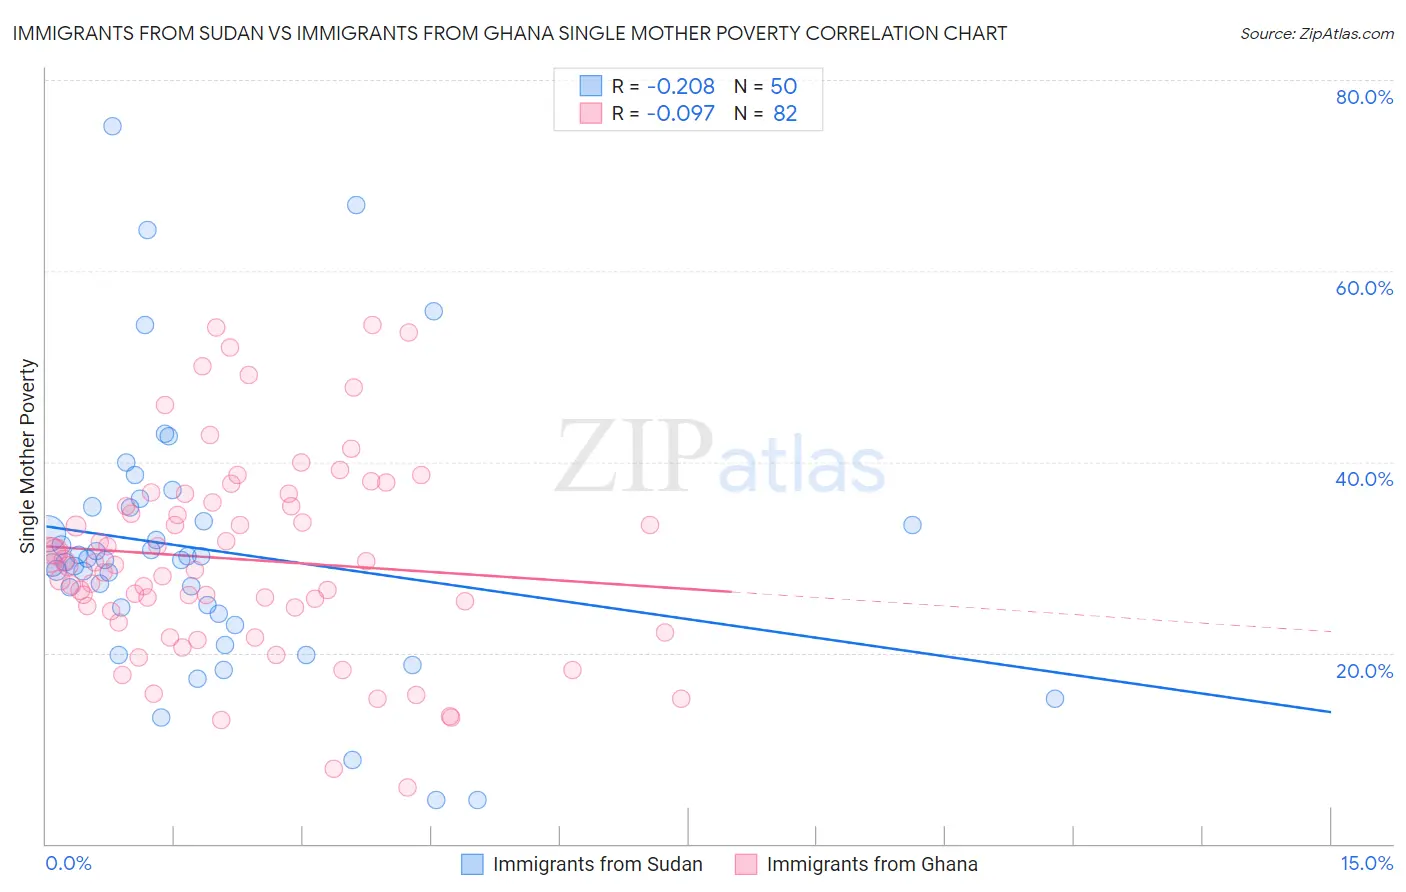
Immigrants from Sudan vs Immigrants from Ghana Single Mother Poverty Correlation Chart
The statistical analysis conducted on geographies consisting of 118,210,366 people shows a weak negative correlation between the proportion of Immigrants from Sudan and poverty level among single mothers in the United States with a correlation coefficient (R) of -0.208 and weighted average of 30.1%. Similarly, the statistical analysis conducted on geographies consisting of 197,667,046 people shows a slight negative correlation between the proportion of Immigrants from Ghana and poverty level among single mothers in the United States with a correlation coefficient (R) of -0.097 and weighted average of 29.9%, a difference of 0.71%.
Single Mother Poverty Correlation Summary
| Measurement | Immigrants from Sudan | Immigrants from Ghana |
| Minimum | 4.5% | 5.9% |
| Maximum | 75.1% | 54.4% |
| Range | 70.6% | 48.5% |
| Mean | 30.8% | 29.8% |
| Median | 29.7% | 29.1% |
| Interquartile 25% (IQ1) | 24.1% | 24.3% |
| Interquartile 75% (IQ3) | 35.2% | 35.8% |
| Interquartile Range (IQR) | 11.1% | 11.5% |
| Standard Deviation (Sample) | 14.0% | 10.4% |
| Standard Deviation (Population) | 13.9% | 10.4% |
Demographics Similar to Immigrants from Sudan and Immigrants from Ghana by Single Mother Poverty
In terms of single mother poverty, the demographic groups most similar to Immigrants from Sudan are Spanish (30.1%, a difference of 0.030%), Immigrants from Cuba (30.1%, a difference of 0.070%), Scottish (30.1%, a difference of 0.090%), Immigrants from Liberia (30.1%, a difference of 0.12%), and Sudanese (30.0%, a difference of 0.20%). Similarly, the demographic groups most similar to Immigrants from Ghana are Immigrants from Western Africa (29.9%, a difference of 0.030%), Jamaican (29.9%, a difference of 0.040%), Liberian (29.9%, a difference of 0.050%), Immigrants from Thailand (29.9%, a difference of 0.080%), and Hungarian (29.9%, a difference of 0.12%).
| Demographics | Rating | Rank | Single Mother Poverty |
| Haitians | 13.3 /100 | #210 | Poor 29.8% |
| Guyanese | 12.8 /100 | #211 | Poor 29.8% |
| Nicaraguans | 12.4 /100 | #212 | Poor 29.8% |
| Immigrants | Thailand | 12.0 /100 | #213 | Poor 29.9% |
| Liberians | 11.7 /100 | #214 | Poor 29.9% |
| Jamaicans | 11.7 /100 | #215 | Poor 29.9% |
| Immigrants | Western Africa | 11.5 /100 | #216 | Poor 29.9% |
| Immigrants | Ghana | 11.3 /100 | #217 | Poor 29.9% |
| Hungarians | 10.3 /100 | #218 | Poor 29.9% |
| Finns | 9.3 /100 | #219 | Tragic 30.0% |
| Germans | 8.8 /100 | #220 | Tragic 30.0% |
| Immigrants | Eritrea | 7.7 /100 | #221 | Tragic 30.0% |
| Sudanese | 7.6 /100 | #222 | Tragic 30.0% |
| Immigrants | Cuba | 6.9 /100 | #223 | Tragic 30.1% |
| Immigrants | Sudan | 6.5 /100 | #224 | Tragic 30.1% |
| Spanish | 6.3 /100 | #225 | Tragic 30.1% |
| Scottish | 6.0 /100 | #226 | Tragic 30.1% |
| Immigrants | Liberia | 5.9 /100 | #227 | Tragic 30.1% |
| Spaniards | 5.4 /100 | #228 | Tragic 30.2% |
| Immigrants | Barbados | 5.0 /100 | #229 | Tragic 30.2% |
| English | 4.8 /100 | #230 | Tragic 30.2% |