Immigrants from Sudan vs Immigrants from Eastern Europe Family Poverty
COMPARE
Immigrants from Sudan
Immigrants from Eastern Europe
Family Poverty
Family Poverty Comparison
Immigrants from Sudan
Immigrants from Eastern Europe
10.1%
FAMILY POVERTY
2.3/ 100
METRIC RATING
232nd/ 347
METRIC RANK
8.1%
FAMILY POVERTY
95.6/ 100
METRIC RATING
103rd/ 347
METRIC RANK
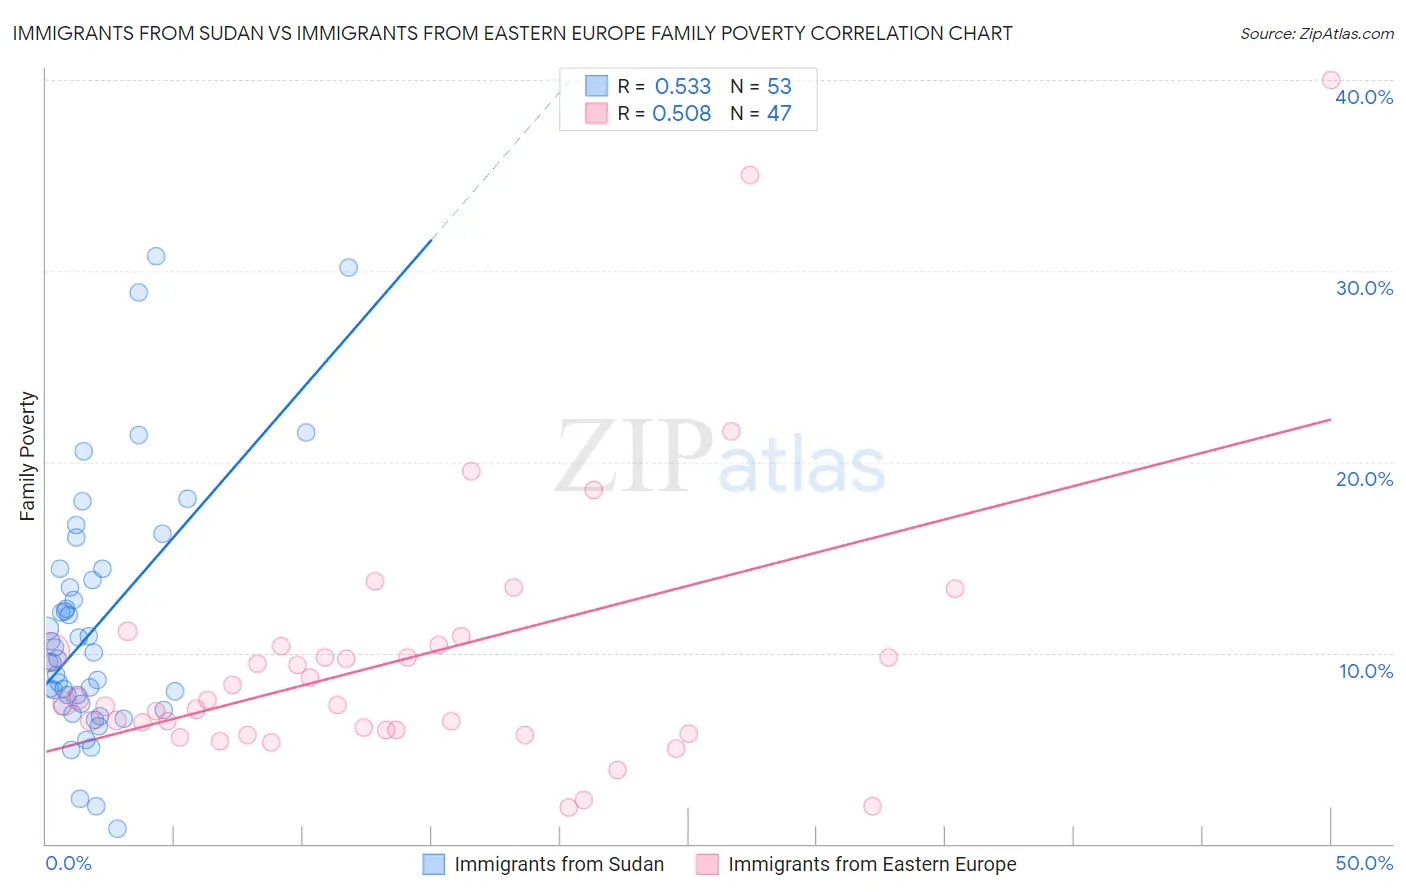
Immigrants from Sudan vs Immigrants from Eastern Europe Family Poverty Correlation Chart
The statistical analysis conducted on geographies consisting of 118,923,711 people shows a substantial positive correlation between the proportion of Immigrants from Sudan and poverty level among families in the United States with a correlation coefficient (R) of 0.533 and weighted average of 10.1%. Similarly, the statistical analysis conducted on geographies consisting of 473,559,356 people shows a substantial positive correlation between the proportion of Immigrants from Eastern Europe and poverty level among families in the United States with a correlation coefficient (R) of 0.508 and weighted average of 8.1%, a difference of 24.8%.
Family Poverty Correlation Summary
| Measurement | Immigrants from Sudan | Immigrants from Eastern Europe |
| Minimum | 0.80% | 1.9% |
| Maximum | 30.8% | 40.0% |
| Range | 30.0% | 38.1% |
| Mean | 11.4% | 9.6% |
| Median | 9.7% | 7.4% |
| Interquartile 25% (IQ1) | 7.3% | 5.9% |
| Interquartile 75% (IQ3) | 14.1% | 10.4% |
| Interquartile Range (IQR) | 6.9% | 4.4% |
| Standard Deviation (Sample) | 6.5% | 7.2% |
| Standard Deviation (Population) | 6.4% | 7.1% |
Similar Demographics by Family Poverty
Demographics Similar to Immigrants from Sudan by Family Poverty
In terms of family poverty, the demographic groups most similar to Immigrants from Sudan are Fijian (10.1%, a difference of 0.25%), Immigrants from Middle Africa (10.1%, a difference of 0.36%), Nigerian (10.1%, a difference of 0.39%), Alaskan Athabascan (10.1%, a difference of 0.43%), and Immigrants from Nigeria (10.2%, a difference of 0.64%).
| Demographics | Rating | Rank | Family Poverty |
| Immigrants | Immigrants | 3.6 /100 | #225 | Tragic 10.0% |
| Ottawa | 3.3 /100 | #226 | Tragic 10.0% |
| Immigrants | Armenia | 3.3 /100 | #227 | Tragic 10.0% |
| Sudanese | 3.1 /100 | #228 | Tragic 10.0% |
| Immigrants | Uzbekistan | 3.1 /100 | #229 | Tragic 10.0% |
| Immigrants | Panama | 3.1 /100 | #230 | Tragic 10.0% |
| Alaskan Athabascans | 2.7 /100 | #231 | Tragic 10.1% |
| Immigrants | Sudan | 2.3 /100 | #232 | Tragic 10.1% |
| Fijians | 2.1 /100 | #233 | Tragic 10.1% |
| Immigrants | Middle Africa | 2.1 /100 | #234 | Tragic 10.1% |
| Nigerians | 2.0 /100 | #235 | Tragic 10.1% |
| Immigrants | Nigeria | 1.9 /100 | #236 | Tragic 10.2% |
| Immigrants | Laos | 1.7 /100 | #237 | Tragic 10.2% |
| French American Indians | 1.5 /100 | #238 | Tragic 10.2% |
| Potawatomi | 1.5 /100 | #239 | Tragic 10.2% |
Demographics Similar to Immigrants from Eastern Europe by Family Poverty
In terms of family poverty, the demographic groups most similar to Immigrants from Eastern Europe are Slavic (8.1%, a difference of 0.010%), Laotian (8.1%, a difference of 0.040%), Immigrants from Indonesia (8.1%, a difference of 0.090%), Immigrants from Norway (8.1%, a difference of 0.10%), and New Zealander (8.1%, a difference of 0.13%).
| Demographics | Rating | Rank | Family Poverty |
| Immigrants | Turkey | 96.5 /100 | #96 | Exceptional 8.0% |
| Immigrants | Switzerland | 96.1 /100 | #97 | Exceptional 8.1% |
| Immigrants | South Africa | 95.9 /100 | #98 | Exceptional 8.1% |
| Welsh | 95.8 /100 | #99 | Exceptional 8.1% |
| New Zealanders | 95.8 /100 | #100 | Exceptional 8.1% |
| Immigrants | Norway | 95.7 /100 | #101 | Exceptional 8.1% |
| Immigrants | Indonesia | 95.7 /100 | #102 | Exceptional 8.1% |
| Immigrants | Eastern Europe | 95.6 /100 | #103 | Exceptional 8.1% |
| Slavs | 95.6 /100 | #104 | Exceptional 8.1% |
| Laotians | 95.6 /100 | #105 | Exceptional 8.1% |
| Egyptians | 95.1 /100 | #106 | Exceptional 8.1% |
| French Canadians | 95.0 /100 | #107 | Exceptional 8.1% |
| Basques | 94.9 /100 | #108 | Exceptional 8.1% |
| Jordanians | 94.8 /100 | #109 | Exceptional 8.2% |
| Romanians | 94.7 /100 | #110 | Exceptional 8.2% |